🔮 #KAVA Analysis
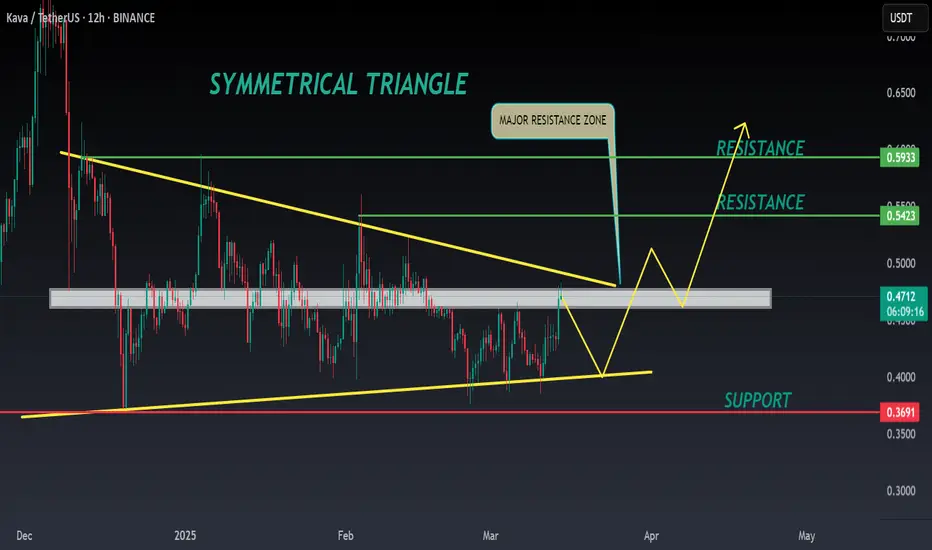
💲💲 #KAVA is trading in a Symmetrical Triangle Pattern. If the price of #KAVA breaks and sustain the higher price then will see a pump. Also there is an instant strong support zone. We may see a retest towards the support zone first and then a reversal📈
⁉️ What to do?
- We have marked crucial levels in the chart [ #KAVA ]. We can trade according to the chart and make some profits. 🚀
#KAVA #Cryptocurrency #Support #Resistance #DYOR
Become profitable trader!
Try our channels for Crypto Signals, Alerts and Secret Indicators
linktr.ee/zeus_market_alerts
Join our FREE Channel On Telegram linktr.ee/zeus_market_alerts
Try our channels for Crypto Signals, Alerts and Secret Indicators
linktr.ee/zeus_market_alerts
Join our FREE Channel On Telegram linktr.ee/zeus_market_alerts
Verbundene Veröffentlichungen
Haftungsausschluss
Die Informationen und Veröffentlichungen sind nicht als Finanz-, Anlage-, Handels- oder andere Arten von Ratschlägen oder Empfehlungen gedacht, die von TradingView bereitgestellt oder gebilligt werden, und stellen diese nicht dar. Lesen Sie mehr in den Nutzungsbedingungen.