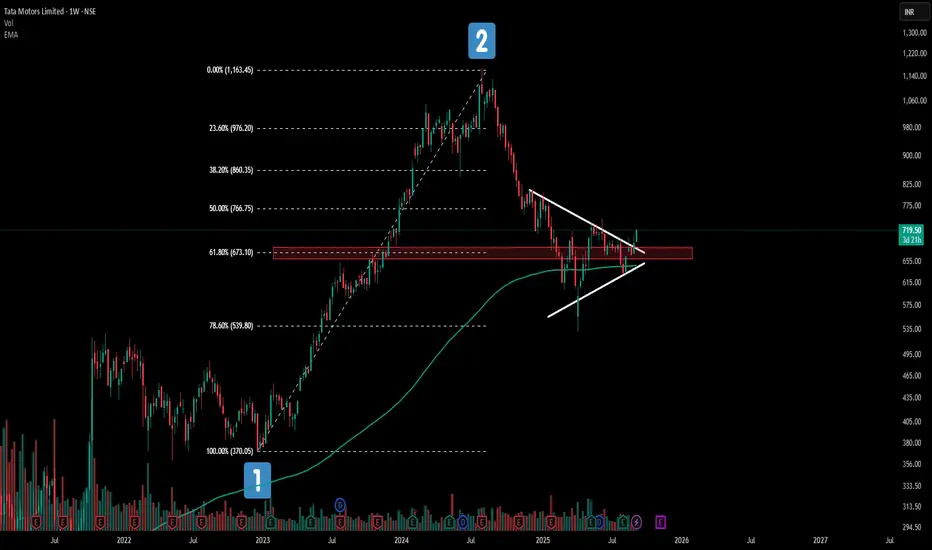
Tata Motors weekly chart is painting a fascinating picture right now!
📊 Price action is dancing around the 61.8% Fibonacci retracement - a golden ratio traders love to watch.
🎯What makes this even more intriguing? The 200 EMA is playing perfect host to this consolidation party
✨While a symmetrical triangle pattern quietly takes shape. It's like watching three technical forces align in one.
Keeping it simple .
⚠️ This analysis is for educational purposes only and should not be considered as financial advice. Trading and investing in stocks involves substantial risk of loss. Please conduct your own research and consult with a qualified financial advisor before making any investment decisions
🎯 Master My Self-Made Trading Strategy
✅ WhatsApp (Learn Today): wa.me/919455664601
📈 Telegram (Learn Today): t.me/hashtaghammer
✅ WhatsApp (Learn Today): wa.me/919455664601
📈 Telegram (Learn Today): t.me/hashtaghammer
Verbundene Veröffentlichungen
Haftungsausschluss
Die Informationen und Veröffentlichungen sind nicht als Finanz-, Anlage-, Handels- oder andere Arten von Ratschlägen oder Empfehlungen gedacht, die von TradingView bereitgestellt oder gebilligt werden, und stellen diese nicht dar. Lesen Sie mehr in den Nutzungsbedingungen.