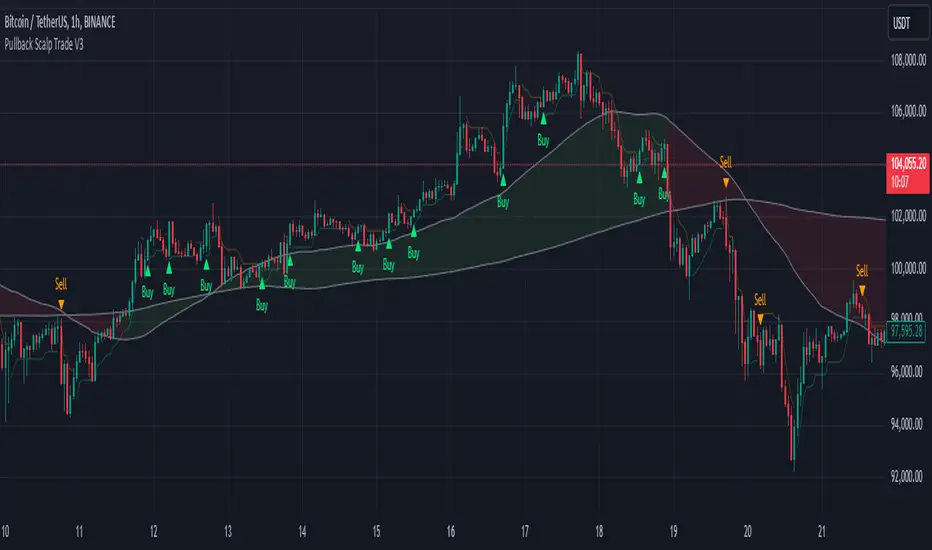
Pullback Scalp Trade V2Pullback Scalp Trading Indicator
This indicator combines multiple technical analysis tools to identify potential pullback trading opportunities in trending markets. It uses a dual moving average system along with RSI for confirmation, providing a comprehensive approach to trend-following and momentum trading.
Key Features:
1. Trend Identification:
- Uses 50 and 200 period moving averages to define the overall trend
- Visual trend zone highlighting for clear market direction
- Customizable MA periods for different timeframes
2. Signal Generation System:
- Combines RSI crossovers with trend direction
- Buy signals occur when:
* Price is above 200 MA (uptrend)
* RSI crosses above its SMA
* RSI is below the lower threshold (default 50)
- Sell signals occur when:
* Price is below 200 MA (downtrend)
* RSI crosses below its SMA
* RSI is above the upper threshold (default 50)
3. Customizable Parameters:
- Short and Long MA periods
- MA types (SMA, EMA, VWMA)
- RSI length and RSI-SMA length
- RSI signal thresholds
- Trend MA periods
Usage Guidelines:
- Best used on higher timeframes (1H and above) for trend trading
- Wait for price to respect the trend zone before taking trades
- Use additional confirmation from price action or other indicators
- Adjust RSI levels based on market volatility
Limitations:
- Like all indicators, this tool may generate false signals in choppy markets
- Should not be used as a sole decision-making tool
- Past performance does not guarantee future results
----------
Türkçe Açıklama:
Bu indikatör, trendli piyasalarda potansiyel geri çekilme fırsatlarını belirlemek için birden fazla teknik analiz aracını birleştirir. Trend takibi ve momentum ticareti için kapsamlı bir yaklaşım sunan ikili hareketli ortalama sistemi ile RSI'yı bir arada kullanır.
Temel Özellikler:
1. Trend Belirleme:
- Genel trendi tanımlamak için 50 ve 200 periyotlu hareketli ortalamalar
- Görsel trend bölgesi vurgulaması
- Farklı zaman dilimleri için özelleştirilebilir MA periyotları
2. Sinyal Üretim Sistemi:
- RSI kesişimlerini trend yönü ile birleştirir
- Alış sinyalleri şu durumlarda oluşur:
* Fiyat 200 MA'nın üzerinde (yükseliş trendi)
* RSI, SMA'sını yukarı keser
* RSI alt eşiğin altında (varsayılan 50)
- Satış sinyalleri şu durumlarda oluşur:
* Fiyat 200 MA'nın altında (düşüş trendi)
* RSI, SMA'sını aşağı keser
* RSI üst eşiğin üzerinde (varsayılan 50)
3. Özelleştirilebilir Parametreler:
- Kısa ve Uzun MA periyotları
- MA tipleri (SMA, EMA, VWMA)
- RSI uzunluğu ve RSI-SMA uzunluğu
- RSI sinyal seviyeleri
- Trend MA periyotları
Kullanım Önerileri:
- Trend ticareti için yüksek zaman dilimlerinde (1S ve üzeri) kullanılması önerilir
- İşlem almadan önce fiyatın trend bölgesine saygı göstermesini bekleyin
- Fiyat hareketi veya diğer indikatörlerden ek teyit alın
- RSI seviyelerini piyasa volatilitesine göre ayarlayın
Sınırlamalar:
- Tüm indikatörler gibi, dalgalı piyasalarda yanlış sinyaller üretebilir
- Tek başına karar verme aracı olarak kullanılmamalıdır
- Geçmiş performans, gelecekteki sonuçların garantisi değildir
In den Scripts nach "scalp" suchen
Pip hunter 1-Minute Scalping Strategy [manesisnet]NOTE: This is my first attempt to write an indicator using pine script and it's not recommended for serious trading, just use it for your own research or feel free to create your own versions based on the below.
Overview: The "1-Minute Scalping Strategy" is a custom TradingView indicator designed for short-term traders looking to capitalize on quick price movements in the 1-minute timeframe. This strategy combines moving averages and the Relative Strength Index (RSI) to generate buy and sell signals while filtering out potential false entries by confirming trends on a higher timeframe.
How It Works:
Moving Averages:
The indicator uses two Simple Moving Averages (SMAs):
A fast SMA (5-period) for short-term price movements.
A slow SMA (20-period) to identify the overall trend.
Buy signals are generated when the fast SMA crosses above the slow SMA, indicating bullish momentum.
Sell signals occur when the fast SMA crosses below the slow SMA, indicating bearish momentum.
Higher Time Frame Confirmation:
To enhance the accuracy of the signals, the strategy checks the trend on a higher timeframe (default is 5 minutes).
A buy signal is only valid if the current price is above the higher timeframe SMA, confirming that the overall trend is bullish.
A sell signal is only valid if the current price is below the higher timeframe SMA, confirming a bearish trend.
This confirmation helps avoid false breakouts and ensures that trades are aligned with the prevailing market direction.
Relative Strength Index (RSI):
The RSI is used to assess market momentum and potential reversal points.
The indicator calculates a 14-period RSI to identify overbought and oversold conditions.
For buy signals, the RSI must be below 60 (indicating the market is not overbought).
For sell signals, the RSI must be above 40 (indicating the market is not oversold).
This helps to filter out trades that might occur during extreme market conditions.
Visual Representation:
The fast SMA (5-period) is plotted in blue, the slow SMA (20-period) in red, and the higher timeframe SMA in orange.
Buy signals are indicated with a green label below the bar, while sell signals are indicated with a red label above the bar.
This visual representation allows traders to quickly identify potential entry points.
Alerts:
The script includes alert conditions for buy and sell signals, enabling traders to receive notifications when the conditions for entering trades are met.

TradeBuilderOverview
TradeBuilder is an ever-growing toolbox that lets you combine and compound any number of bundled indicators and algorithms to create a compound strategy. At launch, we're including two Moving Averages (SMA, EMA), RSI, and Stochastic Oscillator, with many more to come. You can use any combination of indicators, be it just one, two, or all.
Key Concepts
Indicator Integration: Tradebuilder allows the use of Moving Averages, RSI, and Stochastic Oscillators, with customizable parameters for each. More indicators to come.
Mode Selection : Choose between Confirm Trend Mode (using indicators to confirm trends) and Momentum Mode (using indicators to spot reversals).
Trade Flexibility : Offers options for both long and short trades, enabling diverse trading strategies.
Customizable Inputs : Easily toggle indicators on or off and adjust specific settings like periods and thresholds.
Signal Generation : Combines multiple conditions to generate entry and exit signals.
Input Parameters:
Moving Average (MA):
use_ma : Enable this to include the Moving Average in your strategy.
ma_cross_type : Choose between "Close/MA" (price crossing the MA) or "MA/MA" (one MA crossing another).
ma_length : Set the period for the primary MA.
ma_type : Choose between "SMA" (Simple Moving Average) or "EMA" (Exponential Moving Average).
ma_length2 : Set the period for the secondary MA if using the "MA/MA" cross type.
ma_type2 : Set the type for the secondary MA.
Relative Strength Index (RSI):
use_rsi : Enable this to include RSI in your strategy.
rsi_length : Set the period for RSI calculation.
rsi_overbought : Define the overbought level.
rsi_oversold : Define the oversold level.
Stochastic Oscillator:
use_stoch : Enable this to include the Stochastic Oscillator in your strategy.
stoch_k : Set the %K period.
stoch_d : Set the %D period.
stoch_smooth : Define the smoothing factor.
stoch_overbought : Set the overbought level.
stoch_oversold : Set the oversold level.
Confirmation or Momentum Mode:
confirm_trend : Set this to true to use RSI and Stochastic Oscillator to confirm trends (long when above overbought, short when below oversold). Set to false to trade on momentum (short when above overbought, long when below oversold).
Tip: When set to false and used with just momentum oscillators like Stochastic or RSI, it's geared toward scalping as it essentially becomes momentum trading.
Trade Directions:
trade_long : Enable to allow long trades.
trade_short : Enable to allow short trades.
Example Strategy on E-mini S&P 500 Index Futures ( CME_MINI:ES1! ), 1-minute Chart
Let’s say you want to create a strategy to go long when:
A 5-period SMA crosses above a 100-period EMA.
RSI is above 20.
The Stochastic Oscillator is above 95.
Trend Confirmation Mode is on.
For short:
A 5-period SMA crosses below a 100-period EMA.
RSI is below 45.
The Stochastic Oscillator is below 5.
Trend Confirmation Mode is on.
Here’s how you would set it up in Tradebuilder:
use_ma = true
ma_cross_type = "MA/MA"
ma_length = 5
ma_type = "SMA"
ma_length2 = 100
ma_type2 = "EMA"
use_rsi = true
rsi_length = 14
rsi_overbought = 20
rsi_oversold = 45
use_stoch = true
stoch_k = 8
stoch_d = 1
stoch_smooth = 1
stoch_overbought = 95
stoch_oversold = 5
confirm_trend = true
trade_long = true
trade_short = false
Alerts
Here is how to set TradeBuilder alerts: open a TradingView chart, attach TradeBuilder, right-click on chart -> Add Alert. Condition: Symbol (e.g. NQ) >> TradeBuilder >> Open-Ended Alert >> Once Per Bar Close.
Development Roadmap
We plan to add many more compoundable indicators to TradeBuilder over the coming months from all walks of technical analysis, including Volume, Volatility, Trend Detection/Validation, Momentum, Divergences, Chart Patterns, Support/Resistance Analysis. etc.

[FXAN] 71 Cygni Algorithm (Scalping)⚜️ FXAN CYGNI INDICATORS ORIGINALITY
Originality comes from proprietary formula we use to measure the relationship between Volume and Price Volatility in relation to overall current market positioning in developing Volume Profile and multiple custom period Volume Profiles. We combine that with our own approach to measure price velocity in correlation to average daily/weekly/monthly ranges of the given market.
The relationship between current volume and price volatility gives us information about how much the volume that is currently coming into the market affects the price movement (volatility) and which side is more dominant/involved in the market (Buyers/Sellers). We call this the "Volume Impact" factor.
This information is then compared in relation to the overall current market positioning in developing Volume Profile and Multiple custom period Volume Profiles. We have created a rating system based on current price positioning in relation to the Volume Profile. Volume profile consists of different volume nodes, high volume nodes where we consider market interest to be high (a lot of transactions - High Volume) and low volume nodes where we consider market interest to be low (not a lot of transactions - Low Volume). We call this the current "Market Interest" factor.
We combine this information with our own approach to measure price velocity in correlation to the higher-timeframe price ranges. Calculation is done by measuring current ranges of market movement in correlation to average daily/weekly/monthly ranges. We call this "Price Velocity" factor.
This approach was applied to develop key components of our Tradingview Indicators, we've simplified some of the calculations and made them easy to use by programming them to display buying/selling volume pressure with colors.
In addition to our own proprietary formulas and criterias to measure volume impact on price, we've also used an array of indicators that measure the percentage change in volume over custom specified periods of time, including custom period ranged Volume Profile, Developing VA, Accumulation/Distribution (A/D Line), Volume Rate of Change (VROC), Volume Price Trend (VPT) - all of them with of course fine-tuned settings to fit the purpose in the overall calculation.
Reasons for multiple indicator use:
Custom period ranged Volume Profiles: To determine current interest of market participants. Used for "Market Interest"
Developing VA: To determine current fair price of the market (value area). Used for "Market Interest".
Accumulation/Distribution (A/D Line): Helping to gauge the strength of buying and selling pressure. Used for "Volume Impact"
Volume Rate of Change (VROC): To give us information about percentage change in volume. Used for "Volume Impact"
Volume Price Trend (VPT): To help identify potential trends. Used for "Volume Impact".
Average True Range (ATR): Used for measuring volatility. Used for "Volume Impact" and "Price Velocity".
Average Daily Range (ADR): Used for measuring average market price movement. Used for "Price Velocity".
How it all works together:
"Volume Impact" factor tells us the influence of incoming market volume on price movement. This information alongside the overall market positioning information derived from "Market Interest" factor combined with information about speed and direction relative to higher-timeframe price ranges frin "Price Velocity.
This is the basis of our proprietary developed Volume Dynamics analysis approach
"Volume Impact" x "Market Interest" x "Price Velocity"
Combining this factors together gives a good overall understanding of which side is currently more involved in the market to gauge the direction ("Volume Impact"), where the market is currently positioned to gauge the context ("Market Interest") and what the current market's momentum to improve the timing of our trades ("Price Velocity"). This increases our probabilities for successful trades, executed with good timing.
To simplify - our indicators will always analyze the volume behind every price movement and rate those movements based on the relationship between movement distance and volume behind it through an array of criterias and rate them.
Colors displayed by the indicators will be a result of that, suggesting which side of the market (Buyers or sellers) is currently more involved in the market, aiming to increase the probabilities for profitable trades. With the help of our indicators you have deep volume analysis behind price movements done without looking at anything else then indicator components.
🔷 OVERVIEW
Cygni 71 Algorithm is a TradingView indicator designed for short-term trading (scalping) and enhancing the precision of your entries/exits based on a higher timeframe market context. It analyzes the underlying volume behind market movements and colors the candles with the help of the Heiken-Ashi methodology to provide a clearer perspective on the market's potential direction and intentions.
🔷 KEY FEATURES
▊ Candle Coloring
▊ Upper Colored Bar
▊ Lower Colored Bar
🔷 HOW DOES IT WORK?
□ Candles will color in reference to the Heiken ashi "average bar" methodology, which uses a modified formula based on two-period averages. This way, you can observe the normal candlesticks with less noise as colors will suggest the most likely direction where the market might be heading.
□ Upper Colored Bar analyzes daily volume dynamics in the market's price action by referencing the daily average price weighted by volume. If the market is bullish, you’ll see the green bars, and if the market is bearish, the bars will color red.
□ Lower Colored Bar analyzes volume dynamics and the market's price action every few second and minute intervals by referencing average price weighted by volume. This makes it much more sensitive than the Upper Colored Bar. If the market is bullish, you’ll see the green bars, and if the market is bearish, the bars will color red.
🔷 HOW TO USE IT?
□ In general, we look for areas where all components are in sync. These are valid trading signals (refer to the usage example below).
□ If all components are not in sync, we should look for at least two of them to be in sync while one of them must be Upper Colored Bar.
□ Candle Colors: Looking for longs when the candles are green and looking for shorts when the colors are red
□ Upper Colored Bar: The most important component of this indicator is that we favor trading in the direction suggested by this component. Additional confirmation of other components is a bonus. The green color suggests a bullish market, trading long. Red color suggests bearish market, trading short.
□ Lower Colored Bar: This should not be used on its own but always combined with at least one of the other components due to its sensitivity. Colors are indicating longs when green and shorts when red.
🔷 COMBINING THE COMPONENTS
Each component of the indicator serves it's own purpose and analyzes the market from it's own perspective and with its own custom settings and formulas. The calculation of the individual component is done independently from other components. Once all of them align, we're able to execute trades with an edge as it signals that different aspects of volume and price analysis line up for the trading opportunity.
- Candle Colors are used for improving the timing of your entries/exits based on market structure
- Upper Colored Bar is used for determining the favorable direction of the market based on Daily Volume Dynamics.
- Lower Colored Bar used for determining the favorable direction of the market based on Second/Minute/3-minute Volume Dynamics.
It's important to combine the components to increase the probability of success - here's how you should look for a trade:
1. Assess the current most favorable market direction by referencing the Upper Colored bar, look for longs if it’s green and for shorts if it’s red
2. Look for the Candle Colors to align with the Upper Colored bar, look for longs if it’s green and for shorts if it’s red
3. Look for short-time frame volume dynamics to align with your entries, by referencing the Lower Colored Bar - look for longs if it’s green and for shorts if it’s red.
A valid example of the trade would be:
- Upper Colored Bar is green, indicating the favorable trading directions is long
- Lower Colored Bar is green, indicating the favorable trading directions is long
- Candle Colors are green, indicating the market structure is favorable to enter your positions
📊 USAGE EXAMPLE

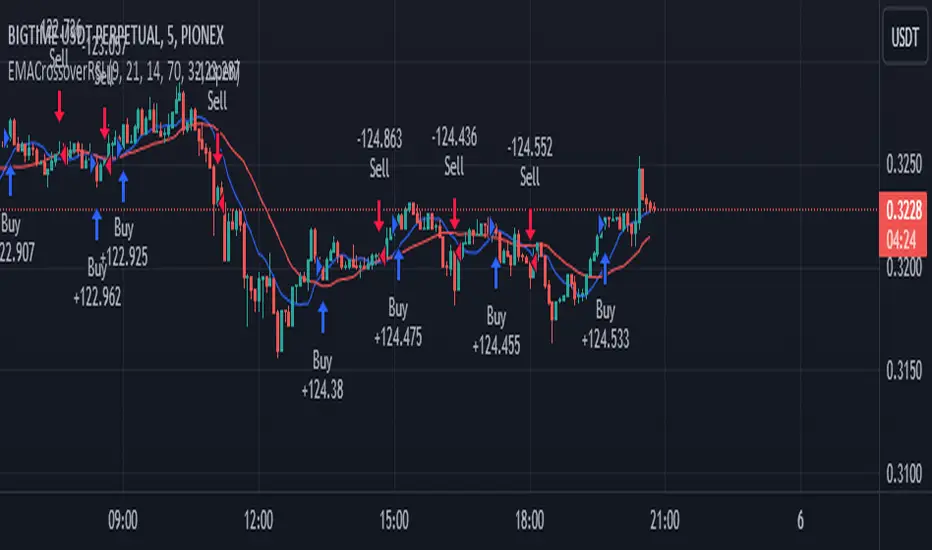
EMA Crossover Strategy with RSI Filter BIGTIME 5mThis script essentially creates a trading strategy that goes long when there is an EMA crossover, but only if the RSI is below a certain overbought level. It goes short when there is an EMA crossunder, but only if the RSI is above a certain oversold level. The moving averages are plotted on the chart for visual reference.
SCALPING 5m
Pairs: BIGTIME/USDT--- API3/USDT---BAKE/USDT--- ZIL/USDT
Volume Footprint Voids [BigBeluga]Volume Footprint Voids is a unique tool that uses lower timeframe calculation to plot different styles of single candle POC.
This indicator is very powerful for scalping and finding very precise entry and exits, spotting potential trapped traders, and more.
Unlike many other volume profiles, this aims to plot single candle profiles as well as their own footprints.
🔶 FEATURES
The script includes the following settings:
Windows: Plotting style and calculations
Coloring modes
Display modes
lower-timeframe calculations
🔶 CALCULATION
In the image above we can see how the script calculates each level position that will serve as a calculation process to see how much volume/closes there are within the levels.
In the image above, we can have a more clear example of how we count each candle close.
We use the prior screenshot as an example, after setting each level we will use the lower-timeframe input to measure the amount of closes within the ranges.
Depending on the lot size, the box will be larger or smaller, usually the POC will always have the highest box size.
NOTE: Size is the starting point, always from the low of the candle.
To find more voids, select a closer LTF to the current one you're using.
To find fewer voids, select a timeframe away from your current one.
Due to Pine Script limitations, we are only able to plot a certain amount of footprints, and we can't plot the whole history chart.
POC will be the largest block displayed, indicating the time point of control
Gray areas are closes above the average
Black are Void or imbalance that price will fill in the future, like FVG
The image above shows an incorrect size input that will lead to bad calculations, while on the other side, a correct size input that will lead to a clear vision and better calculation.
🔶 WINDOWS
The "▲▼" Mode will display delta buyers and delta sellers coloring with voids as black.
It also offers a gradient mode for a beautier visualization
The "Total Volume" mode will display the net volume within the lot size (closes within the levels).
This is useful to spot possible highest net volume within the same highest lot size.
The "POC + Gaps" will show both POC and Gaps as the highest block while all the rest will be considered as the smaller block.
This is useful to see where the highest lot were and if there are higher or lower imbalances within the candle
The last option "Gaps" will simply display the gaps as the highest block, while the POC as the lowest block.
This is useful to have a better view of the gaps areas
🔶 EXAMPLE
This is one of the most basic examples of how this script can be used. POC at the bottom creating a strong support area as price holds and creates higher voids gap that price fills while rising.
🔶 SETTINGS
Users have full control over the script, from colors to choosing the lower-timeframe inputs to disabling the lot size.

Bank Nifty ScalpingThis indicator is designed for scalping purposes.
Users have the option to input the desired source and enable or disable the following indicators:
Multiple EMA (Exponential moving average)
Simultaneously displays multiple moving averages to quickly identify shifts in momentum and obtain confirmation from slower-moving averages.
By default, the EMA display settings are configured to show the 20-day EMA and the 200-day EMA. However, users have the flexibility to modify the display settings according to their preferences. This means that users can customize the indicator to show the EMA values of their choice, such as EMA 50 and EMA 100.
VWAP ( Volume weighted average price )
Default value is set to ‘hl2’
A bullish trend is indicated when the price is above the Volume Weighted Average Price (VWAP), while a bearish trend is indicated when the price is below the VWAP.
VWMA ( Volume weighted moving average )
In the VWMA (Volume Weighted Moving Average) indicator, a default value of 20 is used. If the price is higher than the VWMA, it typically indicates a bullish trend. Conversely, if the price is lower than the VWMA, it suggests a bearish trend. The VWMA takes into account both price and volume, providing a weighted average that can help identify shifts in market sentiment.
Multiple SuperTrends
Default value is 10 and 2 / 10 and 3
A bullish trend is identified when the price is above the SuperTrend indicator, whereas a bearish trend is observed when the price is below the SuperTrend indicator.
Camarilla Pivot Points (Level 3 and 4 only)
Levels 3 and 4 serve as crucial support and resistance levels, acting as the final line of defense against strong trends. These levels are expected to generate reversals, where price often changes direction.
CPR ( Central Pivot Points)
The Daily Central Pivot Point Indicator is a popular tool used in technical analysis. It calculates several levels based on the previous day's high, low, and closing prices.
Strong Volume
The user has the ability to set the average volume for Nifty and BankNifty indices to calculate strong volume.
Elder Impulse System
The Impulse System, developed by Alexander Elder and discussed in his book "New Trading for a Living," is a censorship trading system designed to determine whether a trade should be allowed or prohibited. Additionally, it can be used to identify when a trend is starting to weaken. The Impulse System relies on the following factors:
1. Slope of a Fast Exponential Moving Average (EMA): The fast EMA's slope reflects the price's inertia or momentum.
2. Slope of the Moving Average Convergence Divergence (MACD): The MACD's slope indicates the strength or power of the price movement.
Based on these factors, the Impulse System categorizes candles or price bars into three colors:
* Green Candle: When both the fast EMA and MACD are rising, indicating upward momentum.
* Red Candle: When both the fast EMA and MACD are declining, suggesting downward momentum.
* Blue Candle: In all other cases where the conditions for green or red candles are not met, representing a neutral or uncertain market condition.
By applying the Impulse System, traders can gain insights into the market trend, its strength, and potential shifts in momentum, helping them make informed trading decisions.
Happy Trading

Exhaustion Improved Scalping Consolidation and Squeeze IndicatorThis custom indicator, called " Exhaustion & Improved Scalping Consolidation and Squeeze Indicator," is designed to help traders identify potential trading opportunities in the context of price consolidations, squeezes, and momentum exhaustion. It is an overlay indicator that combines several popular technical analysis tools, including the Relative Strength Index (RSI), Moving Average Convergence Divergence (MACD), Bollinger Bands, Keltner Channels, and Rate of Change (ROC). By analyzing these metrics, the indicator aims to provide visual cues on price charts to support better decision-making in the markets.
Use Case for Trading:
Consolidation Detection: The indicator identifies periods of price consolidation, which typically occur when a market is experiencing low volatility and trading in a narrow range. During these periods, the RSI value is between 45 and 55, the MACD histogram is close to zero, and the ROC value is low. The indicator highlights these consolidation periods by coloring the price bars yellow. Traders can use this information to anticipate potential breakouts and prepare for a possible trend initiation.
Squeeze Detection: The indicator detects squeezes by comparing the Bollinger Bands and Keltner Channels. A squeeze occurs when the Bollinger Bands are within the Keltner Channels, indicating that price volatility is decreasing. The indicator colors the price bars orange during a squeeze, which can be a signal for traders to watch for an upcoming increase in volatility and potential trend expansion.
Momentum Exhaustion Detection: The indicator identifies exhaustion in momentum by analyzing the RSI and MACD histogram. When the RSI is above 70, indicating overbought conditions, and the MACD histogram is decreasing, it may signal that the current upward momentum is losing strength. The indicator colors the price bars white in these situations. Traders can use this information to potentially exit long positions or prepare for a trend reversal.

Parabolic Scalp Take Profit[ChartPrime]Indicators can be a great way to signal when the optimal time is for taking profits. However, many indicators are lagging in nature and will get market participants out of their trades at less than optimal price points. This take profit indicator uses the concept of slope and exponential gain to calculate when the optimal time is to take profits on your trades, thus making this a leading indicator.
Usage:
In essence the indicator will draw a parabolic line that starts from the market participants entry point and exponentially grows the slope of the line eventually intersecting with the price action. When price intersects with the parabolic line a take profit signal will appear in the form of an x. We have found that this take profit indicator is especially useful for scalp trades on lower timeframes.
How To Use:
Add the indicator to the chart. Click on the candle which the trade is on. Click on either the price which the trade will be at, or at the bottom of the candle in a long, or the top of a candle in a short. Select long or short. Open the settings of the indicator and adjust the aggressiveness to the desired value.
Settings:
- Start Time -- This is the bar in which your entry will be at, or occured at and the script will ask you to click on the bar with your mouse upon first adding the script.
- Start Price -- This is the price in which the entry will be at, or was at and the script will ask you to click on the price with your mouse upon first adding the script.
- Long/Short -- This is a setting which lets the script know if it is a long or a short trade, and the script will ask you to confirm this upon first adding it to the chart.
- Aggressiveness -- This directly affects how aggressive the exponential curve is. A value of 101 is the lowest possible setting, indicating a very non-aggressive exponential buildup. A value of 200 is the highest and most aggressive setting, indicating a doubling effect per bar on the slope.

Ema ScalpThis is another simple strategy based on ema
Entry Buy - 1) when close crossover ema then buy and only open one trade till it not close
2) if previous buy trade is profitable open another trade and check again trade is profitable or not
3)if trade is not profitable reset and wait for sell condition...
Entry Sell -1) when close crossunder ema then sell and only open one trade till it not close
2) if previous sell trade is profitable open another trade and check again trade is profitable or not
3) if trade is not profitable reset and wait for buy condition.....
stop loss and take profit is percentage based ...

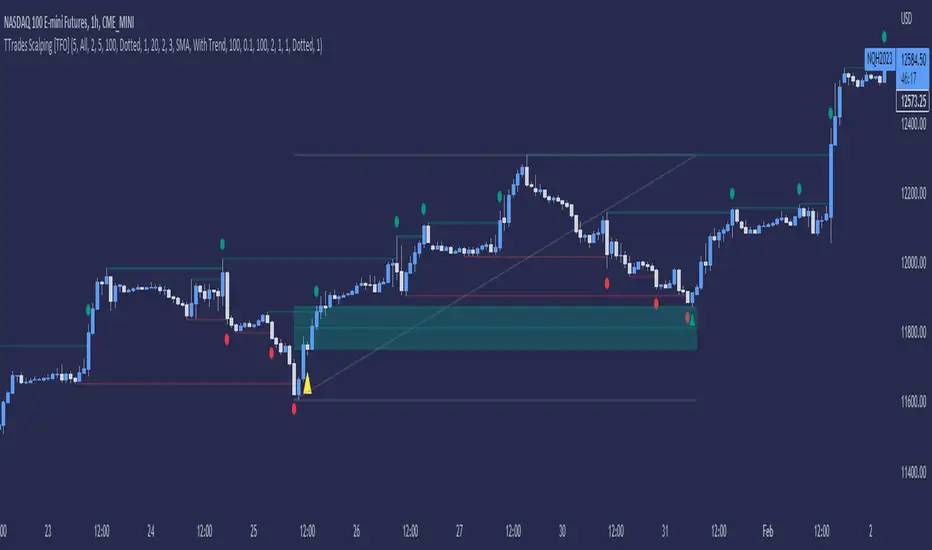
TTrades Scalping Indicator [TFO]Specialized for the scalping strategy of TTrades, this indicator focuses on inducement / stop hunt setups, utilizing additional factors such as volume spikes and trend bias to filter out setups that don’t fit the user-defined criteria.
The idea is that price is always seeking liquidity by reaching for trivial pivots where traders may put their stop loss orders. When price seeks these levels and stops these traders out, we may observe an influx of volume due to the large number of shares/contracts being exchanged given the large number of traders that have similar orders.
If price quickly comes back into the original range, we may determine this to be a stop hunt or a fakeout, only for price to proceed in the opposing direction. If it continues running and creates a displacement leg, we look to capitalize on that movement by tracking the Optimal Trade Entry (62 - 79% retracement), anchored to the swing pivot created as a result of the stop hunt.
Aside from volume, we can also use existing technical indicators like VWAP and SMA’s to ensure we’re only taking trades with the current trend (or against it). Simple criteria like this can help keep us out of low probability market environments.
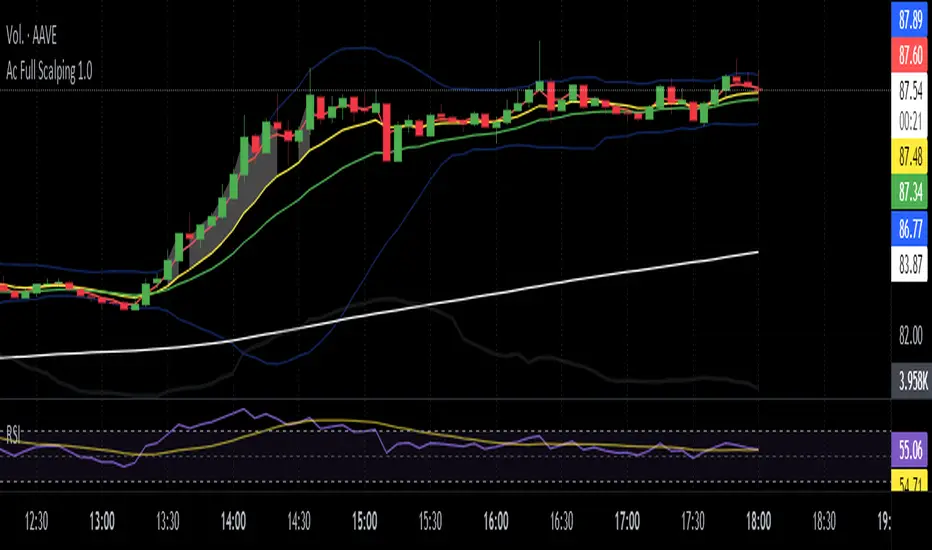
Ac Full Scalping 1.0These unified indicators are used for a 5-minute scalping strategy.
We regularly look for the RSI to be overbought and the price to be outside the bollinger bands as the main analysis.
This serves as a search protocol, to then analyze the price action by visually assisting us with 4 exponential moving averages to see wear or breakout of a move.
It also adds the distance from the price close to the 10-period exponential moving average, developed in two modes where you can mark a background color where the event occurs, or you can choose a shadow that is drawn from the exponential moving average to the closing price.
These two modes can be activated or deactivated so that each person can choose the most visually comfortable way to observe that distance, it is recommended to use one at a time and not both at the same time.
The distance indicator can also be used to change the distance percentage. The percentage as a minimum value admits 0.50%, but it is recommended to use it above 0.80% to make the analysis more effective.
People can also change colors of exponential moving averages, but it is not recommended, and the period cannot be changed to keep the analysis more specific.
The RSI indicator should be added separately, as it is used to see overbought values and divergences.
The other indicators are unified but can be turned on or off for better analysis.
As a summary, what is sought with this type of unified indicators is the attrition, break or retracement in 5-minute time frame to open only short trades.
Dual Bollinger Band Mean ReversionSimple but solid mean reversion indicator with sl and tp levels. Most of the code is based on the built in bollinger bands script. Designed for scalping 1-5 minute timeframes.
The indicator consists of two sets of bollinger bands.
Price has to close below the lower (fast) bollinger band, above the moving average of the (slower) bollinger band.
If price now closes above the lower (fast) bb, the indicator draws a label at the open of the next candle (which would be a potential entry point). Take profit becomes the upper bollinger band, stop loss the same distance below the open of the candle.
I've built in a simple backtesting function that calculates the potential win/loss-ratio. Loss and profit levels are 1:1. Exit strategy could be improved on.
Adjusting the lengths depending on the asset proves to be a good idea.
The slower bollinger bands can help to identify ranging markets and/or trends following regular bollinger bands theory.
Feel free to comment with any changes that you'd like to be made.

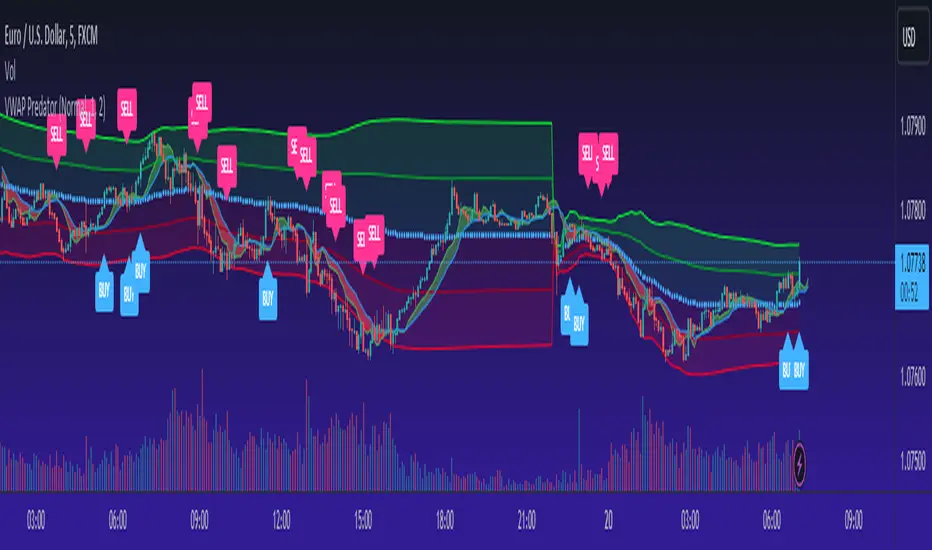
VWAP PredatorUsing VWAP as a start point, the VWAP Predator uses proprietary Fibonacci bands to help determine signal criteria. Most traders use VWAP in a simple way to determine whether an instrument is in a bearish or bullish state, but that doesn't help choosing the correct time to go long or short.
The xBat VWAP Predator uses behavioural analysis with volume, price action with open and close proximities to the Fibonacci bands/zones (Fib Zones). The following describes how the xBrat VWAP Predator is different to any standard use of Volume Weighted Average Price and uses xBrat Proprietary Behavioural logic to determine high probability long and Short signals. All of this heavy lifting and logic is done behind the scenes, keeping traders charts clean.
Long Trading Signals - Candle Coloured in Blue - There are many states with the logic to produce these signals, which are briefly described below:
1. The only standard criteria here - The price action must be above the VWAP Line
2. The Price must open below the boundary of one Fib Zone and close into the next Fib Zone
3. That Same Candle has to be an Accumulation Candle (more volume than the preceding candle and More Buyers) - This is determined with our proprietary logic coding
4. The Same signal candle also has to be higher than average volume. Again, our proprietary xBrat Logic just doesn't look back over a set number of bars, it looks at times of day and day of week, plus more to determine a true valuation of higher, lower or equal to average volume.
5. Only when these states are met, plus two more ema proximity logic, Does the xBrat VWAP predator give a Long Signal.
6. Trade Management is either set targets or indeed a simple ema cross which we provide as a ribbon on the chart to help traders. These ema's are different to entry logic. When the Ribbon turns from green to red, the trader should consider exiting the trade
Short Trading Signals - Candle Coloured in Pink - There are many states with the logic to produce these signals, which are briefly described below:
1. The only standard criteria here - The price action must be below the VWAP Line
2. The Price must open above the boundary of one Fib Zone and close into the next Fib Zone
3. That Same Candle has to be a Distribution Candle (more volume than the preceding candle and More Sellers) - This is determined with our proprietary logic coding
4. The Same signal candle also has to be higher than average volume. Again, our proprietary xBrat Logic just doesn't look back over a set number of bars, it looks at times of day and day of week, plus more to determine a true valuation of higher, lower or equal to average volume.
5. Only when these states are met, plus two more ema proximity logic, Does the xBrat VWAP predator give a Short Signal.
6. Trade Management is either set targets or indeed a simple ema cross which we provide as a ribbon on the chart to help traders. These ema's are different to entry logic. When the Ribbon turns from red to green, the trader should consider exiting the trade.
VWAP Predator is a day trading and scalping signals trading indicator.
EMA + Williams Fractal Pullback [Trading Nerd]EMA Pullback Strategy with Williams Fractal Indicator
Backtesting script that searches for trends (long and short) and a following pullback into the EMAs. It enters on the first Williams Fractal in the desired direction. I found the Strategy on YouTube as a "M1 Scalping Strategy for Bitcoin".
Including fees the strategy is not profitalbe in lower timeframes (at least if not optimized). But it seems to work on higher timeframes as a swing traiding strategy.
Strategy Conditions
Longs:
EMA 1 > EMA 2 and EMA 2 > EMA 3
Number of need to be above the EMA 1
Then a Pullback into the EMAs is required
Enter on the first bullish Williams Fractal
Signal is canceled if the price closes below the EMA 3
Shorts:
EMA 1 < EMA 2 and EMA 2 < EMA 3
Number of need to be below the EMA 1
Then a Pullback into the EMAs is required
Enter on the first bearish Williams Fractal
Singal is canceled if the price closes above the EMA 3
Take Profit
A Risk Reward Take Profit is possible. If you want to use only a trailing Stop Loss, you can set the Take Profit to 'None'
Stop Loss
The default Stop Loss is EMA. If the Pullback has not reached the EMA 2, the Stop Loss is set to the EMA 2. If the Pullback has reached the EMA 2, the Stop Loss is set to the EMA 3.
Other Stop Loss types are available: ATR, HH/LL
Trailing Stop Loss
Available trailing Stop Loss types: ATR, HH/LL. Best practice is to also set the Stop Loss type to the same value.
The Stop Loss is updated if the value from the latest closed candle is greater/less than the previous value for a long/short trade.
Additional
Time Filter: Only opens trade in the defined Session. Open trades are still being closed outside of the Session.
Start Date/End Date: Limits the backtest for the defined Date Range
Trading Days: Only open Trades on the checked Days
Risk % per Trade: If enabled the Strategy uses X% of the capital (defined in Settings -> Properties -> Initial Capital)
Use Compound Interest: If enabled Capital is recalculated for every trade (initial capital + net Profit)
IMPORTANT: For low Timeframes and Markets with tight SL (like Forex) it requires a lower Margin Percent than default. Go to Settings->Properties and lower the required Long/Short Margin. Otherwise Trades might not be considered because of too less capital/marign. Margins can e.g. set to: 2% (Forex), 10% (Stocks), 20% (Crypto).

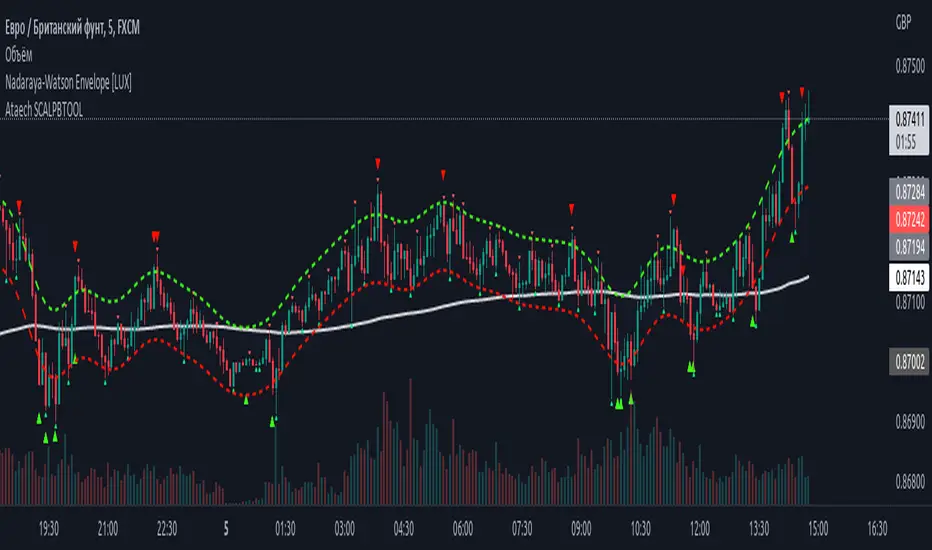
100400 Scalping PullBack Tool R1.1100400 Scalping PullBack Tool R1.1
The following tool smooths the price data using the Nadaraya-Watson estimator, a simple Kernel regression method. We make use of the Gaussian kernel as a weighting function.