Crypto Market Maker w/ BacktestUltimate Trading Tool. Simple af 1.07% . Follow signals, chart if you want to confirm.
Takes only trades with proper risk to reward ratio.
At times calls absolute top and bottom.
Can be used on ALTs as well.
Based on Neural Networks.
Can be used on 60m,30m,15m,5m, 3m 0.32% 0.32% -0.88% - As this is basically a SCALPER. (use with leverage)
Works best in my experience on 15m.
This is strategy for backtest, check my profile for the indicator with alerts.
This Level of Strategy, will not be free. PM for access - Monthly Subscription.
In den Scripts nach "scalp" suchen

Ghost Protocol: Smart Money HUD [Ash_TheTrader]👻 GHOST PROTOCOL: The Institutional HUD
"Stop trading blind. Start seeing where the Smart Money is hiding."
Most indicators lag. They tell you what happened. Ghost Protocol tells you what is happening right now by combining two powerful concepts: Volume Absorption (Whale Defense) and Kinematic Physics (Price Velocity).
This is not just an indicator; it is a complete Heads-Up Display (HUD) for scalpers and day traders on NQ, ES, Gold, and Crypto.
🧠 The Concept: Why It Works
Retail traders lose money for two reasons:
Selling into a bottom (where Whales are absorbing orders).
Buying a fake breakout (where price lacks the energy to continue).
Ghost Protocol solves both by visualizing the invisible battle between aggressive orders (Retail) and passive limit orders (Institutions).
🛠️ The 3 Core Features
1. The "Ghost Walls" (Reversal Detector) 🛡️
What it is: Detects when massive volume hits the market but Price fails to progress. This is Absorption. A "Whale" is using a Limit Order Wall to absorb panic selling or FOMO buying.
The Visual:
🟢 Green Ghost Bubble + Beam: Buyers are absorbing sellers. (Bullish Wall).
🔴 Red Ghost Bubble + Beam: Sellers are absorbing buyers. (Bearish Wall).
Sticky Tech: The bubbles "stick" to the wicks perfectly, regardless of zoom level.
2. The "Velocity Terminal" (Breakout Validator) 🚀
What it is: A Physics Engine for price. It calculates Jerk (Change in Acceleration). Standard breakouts often fail, but a breakout with high "Jerk" (Surge) rarely comes back.
The Visual:
🟣 Plasma Purple Candle: Valid Breakout. Price is moving with high physical energy. Safe to follow.
⚪ Grey/Dull Candle: Fakeout. Price broke a level but lacks energy. The move is likely a trap.
3. The Smart Money Dashboard 💻
A sleek, "Classy" panel in the bottom right corner.
Monitors both engines simultaneously:
GHOST WALL: Scans for Reversals (Buy/Sell Walls).
VELOCITY: Scans for Momentum (Surge/Fakeout).
🎯 How to Trade This Script
Strategy A: The "Whale Reversal" (Scalping)
Step 1: Wait for price to push hard into a level.
Step 2 : A Ghost Wall (Ghost Icon 👻) appears.
Step 3 : A vertical Neon Beam lights up the background.
Action: Take the reversal immediately. Place stop loss just behind the bubble.
Strategy B: The "Physics Breakout" (Trend Following)
Step 1: Price breaks a key resistance or support level.
Step 2: Look at the candle color.
If it is Plasma Purple: ENTER. The physics engine confirms true momentum.
If it is Grey: WAIT. It is likely a fakeout designed to trap you.
⚙️ Settings & Customization
Bubble Distance: Adjust how close the Ghost bubbles sit to the candles.
Sensitivity: Tune the "Jerk Threshold" for the physics engine.
Visuals: Toggle the Background Beams, Dashboard size, and Neon colors to fit your dark/light mode setup.
Created by @Ash_TheTrader Trade with the Whales, not against them.
🎯 Wyckoff Scalping Pro V2🎯 Wyckoff Scalping Pro V2
Short Description:
Advanced Wyckoff methodology combined with order flow, liquidity analysis, and multi-factor scoring system. Professional-grade scalping and day trading tool with 10-point signal strength rating.
Full Description:
Wyckoff Scalping Pro V2 is a comprehensive trading system that combines classical Wyckoff methodology with modern Smart Money Concepts for precision entries in any timeframe.
🎯 What Makes This System Unique?
Unlike basic indicators that just show patterns, this system uses a 10-Point Scoring System to rate every potential trade:
Signal Strength Components:
✅ Wyckoff Patterns (3 points) - Spring, Upthrust, SOS, SOW
✅ Liquidity Grabs (2 points) - Smart Money stop hunts
✅ Trend Alignment (2 points) - Current timeframe trend
✅ HTF Alignment (2 points) - Higher timeframe confirmation
✅ Volume Confirmation (1 point) - Extreme volume spikes
Only signals with 5+ points are displayed, ensuring you only see high-probability setups!
🔥 Core Features
📊 1. Wyckoff Methodology
Four classic accumulation/distribution patterns:
SPRING (Bullish Reversal)
Price breaks below swing low
Quick recovery with volume
Stop losses swept → reversal up
3-point signal component
UPTHRUST (Bearish Reversal)
Price breaks above swing high
Quick rejection with volume
Bull trap → reversal down
3-point signal component
SOS (Sign of Strength)
Strong bullish candle after accumulation
Breakout with volume
Trend initiation signal
SOW (Sign of Weakness)
Strong bearish candle after distribution
Breakdown with volume
Downtrend initiation signal
💹 2. Order Flow Analysis
Order Blocks
Institutional buying/selling zones
Automatic detection based on strong moves
Limited to 10 zones for clean charts
Transparent boxes for minimal clutter
Fair Value Gaps (FVG)
Price imbalances likely to be filled
Minimum size filter (customizable)
Blue (bullish) and purple (bearish)
Maximum 8 gaps shown
Supply & Demand Zones (Optional)
Classic S/D methodology
Fresh zones only
Toggle on/off for preferences
Professional zone labeling
💧 3. Liquidity Analysis
Liquidity Grabs Detection
Identifies sweep of swing highs/lows
Confirms with volume and candle structure
Yellow labels for visibility
Only major liquidity events shown
Why This Matters:
Smart money often "hunts stops" by sweeping liquidity before reversing. These grabs are powerful reversal signals.
📈 4. Multi-Timeframe Trend Analysis
Current Timeframe:
Fast EMA (default: 9)
Slow EMA (default: 21)
Major trend EMA (default: 200)
Higher Timeframe:
Customizable HTF (default: 15min)
Automatic alignment check
Background tint shows HTF trend
Can require HTF confirmation for signals
🎯 5. Two Trading Modes
STRICT MODE (Default - Recommended)
Requires trend alignment
HTF must confirm
Minimum 5/10 strength
Higher win rate, fewer signals
Best for beginners
FAST MODE
No trend requirements
HTF optional
Minimum 5/10 strength
More signals, lower win rate
For experienced scalpers
📊 6. Live Dashboard
Real-time information panel showing:
Current TF trend (Bull/Bear)
HTF trend status
Volume analysis (Normal/High/Extreme)
Major trend (Above/Below 200 EMA)
Active signal (LONG/SHORT/WAIT)
Signal strength (X/10 points)
Operating mode (Strict/Fast)
⚙️ Customization
Signal Filter Settings:
Min Signal Strength: 3-9 (default: 5)
→ Higher = fewer but better signals
Signal Cooldown: 1-20 bars (default: 5)
→ Prevents signal spam
Strict Mode: ON/OFF
→ Requires trend + HTF alignment
Wyckoff Settings:
Wyckoff Period: 10+ (default: 20)
→ Lookback for pattern detection
Volume Threshold: 1.5+ (default: 2.0)
→ How much above average for confirmation
Order Flow:
Order Blocks: Toggle ON/OFF
Liquidity Grabs: Toggle ON/OFF
Fair Value Gaps: Toggle ON/OFF
FVG Min Size: 0.2-5% (default: 0.5%)
Supply/Demand Zones: Toggle ON/OFF (default: OFF)
Trend Filter:
Fast EMA: Default 9
Slow EMA: Default 21
Major EMA: Default 200
Use 200 EMA Filter: Toggle
Multi-Timeframe:
HTF Timeframe: Any (default: 15min)
Require HTF Alignment: Toggle
💡 How To Use
For Scalping (M1-M5):
Set HTF to M15
Use Strict Mode
Min Signal Strength: 6
Focus on liquidity grabs
Quick in and out
For Day Trading (M15-H1):
Set HTF to H1 or H4
Use Strict Mode
Min Signal Strength: 5
Watch all components
Swing for larger moves
For Swing Trading (H4-D1):
Set HTF to Daily or Weekly
Use Strict Mode
Min Signal Strength: 7
Disable S/D zones (less clutter)
Hold for days
🎯 Entry Rules
LONG Entry:
Required:
Green triangle appears below bar
Label shows "LONG"
Strength ≥ 5/10 in dashboard
Optional (for higher probability):
Strength 7+/10
Spring or SOS pattern present
Liquidity grab occurred
HTF shows green trend
Above 200 EMA
Stop Loss:
Below order block or swing low
10-20 pips buffer
Take Profit:
Next supply zone or opposite order block
Minimum 1:2 RRR
SHORT Entry:
Required:
Red triangle appears above bar
Label shows "SHORT"
Strength ≥ 5/10 in dashboard
Optional (for higher probability):
Strength 7+/10
Upthrust or SOW pattern present
Liquidity grab occurred
HTF shows red trend
Below 200 EMA
Stop Loss:
Above order block or swing high
10-20 pips buffer
Take Profit:
Next demand zone or opposite order block
Minimum 1:2 RRR
📊 Best Markets & Timeframes
✅ Forex
All major pairs (EUR/USD, GBP/USD, etc.)
Best on M5-H1
High liquidity = cleaner signals
✅ Gold (XAUUSD)
Excellent for scalping
M5-M15 optimal
Strong liquidity events
✅ Crypto
Bitcoin, Ethereum
M15-H1 recommended
Volatile = more opportunities
✅ Indices
S&P 500, NASDAQ, etc.
M15-H4 optimal
Clear trends
✅ Stocks
Large cap only
Day trading timeframes
Sufficient volume required
🔔 Alert System
Available Alerts:
🟢 LONG Entry Signal
🔴 SHORT Entry Signal
🟡 Bullish Liquidity Grab
🟡 Bearish Liquidity Grab
🔵 Spring Pattern
🔴 Upthrust Pattern
Alert Messages Include:
Ticker symbol
Current price
Signal strength (X/10)
Pattern type
Recommended Setup:
Enable LONG and SHORT entry alerts
Set to "Once Per Bar Close"
Notification to mobile app
📈 Performance Expectations
Realistic Win Rates:
Strict Mode (5/10 min, with trend):
Win Rate: 65-75%
Signals: 3-8 per day (M15)
Best for: Most traders
Strict Mode (7/10 min, HTF aligned):
Win Rate: 75-85%
Signals: 1-3 per day (M15)
Best for: Conservative traders
Fast Mode (5/10 min, no filters):
Win Rate: 55-65%
Signals: 10-20 per day (M15)
Best for: Experienced scalpers
With Liquidity Grabs:
Win Rate: +10-15% increase
Reversal probability very high
Combine with Wyckoff for best results
💎 Pro Tips
Tip #1: Combine Patterns
Best Setup = Liquidity Grab + Spring/Upthrust
→ 80%+ win rate
→ Smart money confirmed on both sides
Tip #2: Use Signal Strength
5-6 points = OK to trade
7-8 points = Excellent trade
9-10 points = Rare, perfect setup
Tip #3: HTF Alignment
When HTF agrees with signal:
→ Larger position size allowed
→ Wider profit targets
→ Higher probability
Tip #4: Volume Matters
"EXTREME" volume in dashboard:
→ Institutional activity confirmed
→ Higher confidence in setup
→ Stronger moves expected
Tip #5: Clean Charts
Turn OFF S/D zones for day trading
Keep only Order Blocks + FVG
Less clutter = better focus
Tip #6: Signal Cooldown
Increase cooldown during:
→ Low volatility periods
→ Range-bound markets
→ To avoid overtrading
Decrease cooldown during:
→ High volatility
→ Trending markets
→ Major news events
🎨 Visual Design
Clean & Professional:
Minimal chart clutter
Only essential information
Transparent zones (92-95%)
Clear signal markers
Professional color scheme
Information Hierarchy:
Entry signals = LARGEST (impossible to miss)
Liquidity grabs = Medium (yellow labels)
Wyckoff patterns = Small (diamonds)
Zones = Transparent backgrounds
🆚 Comparison to Other Indicators
vs. Basic Order Block Indicators:
✅ Multi-factor scoring system
✅ Wyckoff patterns included
✅ Liquidity analysis built-in
✅ HTF confirmation
✅ Volume analysis vs. Simple Wyckoff Indicators:
✅ Order flow integration
✅ Fair value gaps
✅ Signal strength rating
✅ Multi-timeframe analysis
✅ Professional dashboard vs. Complex "All-in-One" Tools:
✅ Not overwhelming
✅ Focused on what matters
✅ Clean visual design
✅ Fast calculations
✅ Beginner-friendly with pro features
🎯 Who Is This For?
✅ Perfect For:
Scalpers (M1-M5)
Day traders (M15-H1)
Swing traders (H4-D1)
Traders learning Wyckoff
Anyone wanting quality over quantity
Traders seeking multi-confirmation
⚠️ Not Ideal For:
Complete beginners (learn basics first)
"Signal chasers" wanting 50+ signals/day
Traders who don't use stop losses
Very long-term investors
📚 Educational Value
This indicator teaches you:
Classical Wyckoff methodology
How institutions hunt liquidity
Order flow analysis
Multi-timeframe confluence
Volume analysis importance
Risk management through scoring
Learn while you trade!
⚡ Technical Specifications
Pine Script v5
Optimized for speed
No repainting
Real-time calculations
Maximum 200 boxes (clean limits)
Maximum 200 lines
Efficient array management
Works on all liquid markets
🚀 Getting Started (Quick Guide)
Add to Chart
Apply to your favorite pair
Default settings work well
Choose Your Mode
Strict Mode: ON (recommended)
HTF: Set to 15min (or higher for H1+ charts)
Set Alerts
LONG Entry Signal
SHORT Entry Signal
Start Small
Demo trade first
Watch signal strength
Learn the patterns
Scale Up
Once comfortable
Increase position size
Focus on 7+ strength signals
🎯 Final Thoughts
Wyckoff Scalping Pro V2 is not just an indicator - it's a complete trading system that respects your screen space while giving you professional-grade analysis.
The 10-point scoring system ensures you're never guessing about signal quality. You always know exactly how strong a setup is before entering.
Quality over quantity - This system prioritizes high-probability setups over signal spam. You might see 3-8 signals per day on M15, and that's exactly the point. Each one is carefully filtered.
📞 Support & Feedback
Questions? Drop a comment below!
Found this useful? Hit that ⭐ button!
Have suggestions? I'm listening!
Happy Trading! 🚀📈

VWAP-RSI Scalper FINAL v1Description
This script implements a robust, battle-tested intraday scalping strategy designed for prop firm challenges, funded trader programs, and serious futures scalpers.
It combines VWAP, RSI, EMA trend, and ATR-based risk management to capture high-probability mean reversion and momentum moves during the most liquid hours of the trading day.
Core Logic
RSI (Relative Strength Index):
Trades are triggered when the RSI is either oversold or overbought using a short lookback (default: 3). This ensures only the strongest intraday reversals or exhaustion moves are considered.
VWAP Filter:
Longs are only taken above VWAP, shorts only below VWAP, aligning trades with the session’s dominant bias.
EMA Filter:
Additional trend quality filter—longs require price above EMA, shorts below EMA.
Session Control:
Only trades between user-defined session hours (default: US cash session), eliminating overnight/illiquid action.
ATR-based Dynamic Stops & Targets:
Every trade uses a stop loss at 1x ATR and a take profit at 2x ATR for a positive risk/reward ratio.
Max Trades Per Day:
Prevents overtrading and controls risk exposure (default: 3).
Performance (Sample Backtest)
Profit Factor: 1.37+ (prop-firm quality)
Drawdown: <1% (very conservative risk)
Win Rate: 37–48% (RR > 1, so high edge)
Consistency: Smooth, steady equity curve over hundreds of trades.
Best For:
ES/NQ/CL/GC intraday traders
Prop firm evaluation challenges (Tradeify, Topstep, Apex, etc.)
Anyone needing robust, no-nonsense systematic edge for futures or indices.
How to Use & Tune
Apply to 3min, 5min, or 15min charts of liquid futures or indices.
Change parameters in the settings panel to suit your asset, volatility, or session hours.
Use “Strategy Tester” to validate P&L, win rate, and drawdown.
How to Optimize
Raise/lower RSI length or bands to make signals more/less frequent.
Adjust stop/target multiples for your preferred risk/reward profile.
Change session hours to match your broker or market.
Disclaimer
This is not financial advice. Use on a demo or sim account first. Results will vary by market, slippage, and execution speed. Past performance does not guarantee future results.
If you find this useful, please give it a like, follow for more strategies, and comment your results or questions!
Good luck and safe trading!

RSI with Bollinger Bands Scalp Startegy (1min)
------------------------------------------------------------------------------
The "RSI with Bollinger Bands Scalp Strategy (1min)" is a highly effective tool designed for traders who engage in short-term scalping on the 1-minute chart. This indicator combines the strengths of the RSI (Relative Strength Index) and Bollinger Bands to generate precise buy signals, helping traders make quick and informed decisions in fast-moving markets.
How It Works:
RSI (Relative Strength Index):
The RSI is a widely-used momentum oscillator that measures the speed and change of price movements. It operates on a scale of 0 to 100 and helps identify overbought and oversold conditions in the market.
This strategy allows customization of the RSI's lower and upper bands (default settings: 30 for the lower band and 70 for the upper band) and the RSI length (default: 14).
Bollinger Bands:
Bollinger Bands consist of a central moving average (the basis) and two bands that represent standard deviations above and below the basis. These bands expand and contract based on market volatility.
In this strategy, the Bollinger Bands are used to identify potential buy and sell signals based on the price's relationship to the upper and lower bands.
Signal Generation:
Buy Signal: A buy signal is triggered when two conditions are met:
The RSI value falls below the specified lower band, indicating an oversold condition.
The price crosses below the lower Bollinger Band.
The buy signal is then issued on the first positive candle (where the closing price is greater than or equal to the opening price) after these conditions are met.
Sell Signal: In this version of the strategy, the sell signal is currently disabled to focus solely on generating and optimizing the buy signals for scalping.
Strategy Highlights:
This indicator is particularly effective for traders who focus on 1-minute charts and want to capitalize on rapid price movements.
The combination of RSI and Bollinger Bands ensures that buy signals are only generated during significant oversold conditions, helping to filter out false signals.
Customization:
Users can adjust the RSI length, Bollinger Bands length, and the standard deviation multiplier to better fit their specific trading style and the asset they are trading.
The moving average type for Bollinger Bands can be selected from various options, including SMA, EMA, SMMA, WMA, and VWMA, allowing further customization based on individual preferences.
Usage:
Use this indicator on a 1-minute chart to identify potential buy opportunities during short-term price dips.
Since the sell signals are disabled, this strategy is best used in conjunction with other indicators or strategies to manage exit points effectively.
This "RSI with Bollinger Bands Scalp Strategy (1min)" indicator is a valuable tool for traders looking to enhance their short-term trading performance by focusing on high-probability entry points in volatile market conditions.

Entry helperHello traders,
This is a script I use daily as a scalper and it helps me a lot, maybe it can help you, this is why I am sharing it!
PART 1 - DESCRIPTION
This program is specifically designed to help scalpers but can be used for all types of trading but won't be as useful.
This script is what I call an entry helper as it calculates dynamically the position size, stop loss and take profit levels and more.
When scalping and placing market entry orders, the price can move significantely while you are calculating your position size according to your stop loss, capital, risk and especially close price that changes very quickly, this results in a risk that is not ideally controlled and personally was a source of frustration and stress. I wanted to enter my quantity and stop loss values as fast as possible and make the process easier.
This script automates the calculation of the position size, stop loss and take profit levels according the the users input and prints the data visibly on the screen so it is easy to copy by the trader. It allows the trader to be confident that his risk is as controlled as possible.
The script is easy to use and set up, this guide will help you if you have any difficulies or questions.
PART 2 - HOW TO USE THE SCRIPT
- SET THE CAPITAL SETTINGS
1 - Set your capital value in $
- SET THE TRADE SETTINGS
2 - Set your trade side (BUY or SELL)
3 - Set you desired risk in % of your capital
- ENTRY SETTINGS
4 - Set your entry from 2 different options
|MARKET| (default option)
This option will place the entry level at the last available price
|LIMIT|
This option allows you to input a fixed price level for the entry
- STOP LOSS SETTINGS
5 - Select your stop loss placement from 4 different options
|EXTREMA STOP LOSS| (default option)
This option will place the stop loss at the highest/lowest (extrema) price level within the last N candles
|ATR EXTREMA|
This option uses the same price level as the EXTREMA STOP LOSS but will add/soustract the last ATR value (calculated on the N last candles) multiplied by a coefficient that you input
|TICKS EXTREMA|
This option uses the same price level as the EXTREMA STOP LOSS but will add/soustract a number of ticks that you input
|PRICE LEVEL|
This option allows you to input a fixed price level for the stop loss
- TAKE PROFIT SETTINGS
6 - Select your take profit from 3 different options
|NONE| (default option)
This option will not display any take profit level, I have added this option as I don't have take profit targets
|RR|
This option uses a risk to reward ratio (reward/risk) that you input, it will automatically calculate the take profit level that corresponds
|PRICE LEVEL|
This option allows you to input a fixed price level for the take profit
- QUANTITY AND FEE SETTINGS
7 - Set the quantity settings, it represents the quantity in a lot (usually 100 000 in forex, 100 in stocks 1 for crypto currencies)
8 - Set the fee per quantity (turning lot)
- VISUAL SETTINGS
9 - Show or remove the tab
- TAB SETTINGS
10 - Select the data that you want to display in the tab (the tab will adapt automatically)
NOTES:
The vertical dashed line shows what candle has been used for the calculation of the stop loss, it allows you to visualize what candle the script has selected in case of an EXTREMA stop loss option.
I hope this helps you out! Any suggestions are welcome and I hope that the guide is clear enough.
Happy trading!

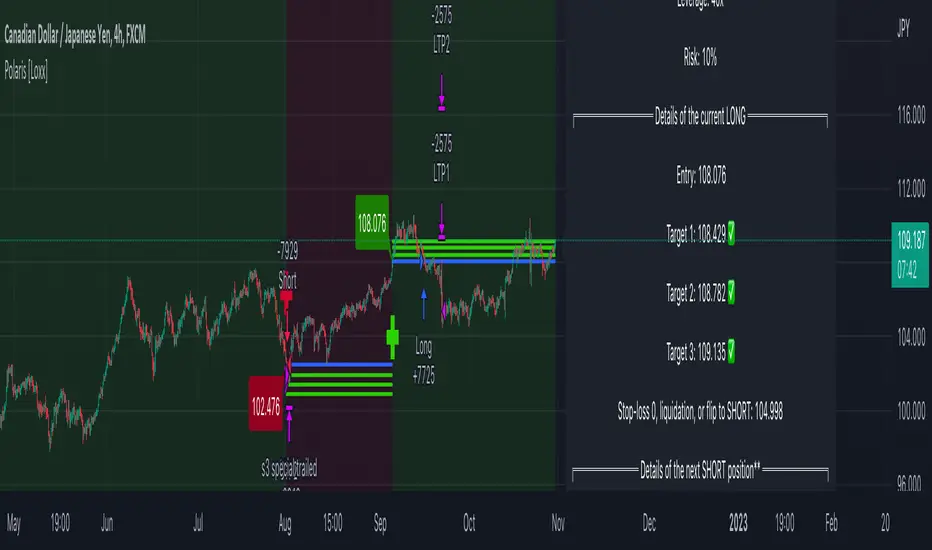
Polaris [Loxx]Polaris is a lower timeframe, high-leverage scalping indicator. It works by scanning for volatility spikes and then calculation the likelihood that those spikes will break market structure to the upside or downside.
Settings
Volatility Type: ATR or TRD , these types will be expanded in future releases.
Volatility Multiplier: How much volatility for market structure break
Filter and source: Proprietary moving average filter period and source type
Equity Calculation Method: Fixed or compounded. This determines trade size. If fixed, then the strategy uses the same quantity per trade, if compounded the strategy uses a percentage of cash on hand as that cash grows or shrinks
% Risk Per Trade: How much you'd like to risk per trade.
Leverage Multiple: How much leverage you'd like to use
% Maintenance Margin: You can find this value posted on the exchange you use
Enabled Forced Liquidation Stop-loss?: If enabled, the strategy will liquidate at measures of leverage automatically. 10x leverage liquidates at 10% opposite move for the trade, for example. This number will be adjusted by the % Maintenance Margin determined by the exchange.
% Minimum Take Profit Cutoff: This controls whether you wish to take trades only over XX% volatility . Since this indicator is to be used for small tight scalps, this keeps you out of trades that are too small to be useful for your desired trading style
Activate Long Pullback Rule?: This controls how the trade is entered. If activated, then the entry won't occur until a pullback happens after market structure break
Activate Short Pullback Rule?: This controls how the trade is entered. If activated, then the entry won't occur until a pullback happens after market structure break
Activate Trend Flip Exits?: Force strategy to exit when trend flips from short to long and long to short
Number of Take Profits: How many take profits levels. 1-5
Activate Trailing Take Profit?: Allows you to set a trailing stop loss after TP2 his hit
Trailing Take Profit Offset Multipler: This determines when the trailing stoploss hits. It's a multiple of volatility
Activate Moving Stop-loss?: Forces the stop loss to move up as targets are reached
Where to Move Stop-loss: At which Take Profit level do we begin to move stoplosses upward with targets
Show dip buying levels: If you have a high risk appetite, these are levels where you could increase your investment size, this has no effect on the strategy but is included for if you wish to manually add to your position size
Activate Longs?: Toggles on/off Longs
Activate Longs?: Toggles on/off Shorts
The remaining settings are multiples of volatility for Take Profits and dip buying levels
UI components
Big green and red plus signs means an entry point. PTF with green and red arrows means "prepare for trend flip". Not every PTF will actually flip the trend. These are just warning shots to make you aware that a possible trend flip is coming. Labels nest to market structure breaks with numbers are the ideal entry level. You can set limit orders at these levels so as to incur less exchange fees on Binance or Bybit for example. The data window provides useful information about the current trade and targets and stoploss of the next upcoming trade giving the current price action of the asset.
Other things to note
this is an extremely high risk strategy depending on how you tune the settings. You can tune down the settings to make it less risky at the cost of profit and hit rate, but that's up to you and your trading style. This can be used all all timeframes, but is meant for timeframes below 4 hours.
MZ HTF HFT ROCit Bot - Non Repainting Scalper v1.2 ADX RSI MOM This is a new iteration based on my Momentum trading bot.
This is an original script meant to be a high frequency trader that works on higher time frame calculations.
I came up with the idea that using calculus I can figure out the actual rate of change and momentum with different calculations than the momentum indicator that is provided by trading view. Once momentum is shifted on a small time frame, it will provide an entry signal. The script is meant to be used on an algorithmic trading system for scalping purposes. It should be run on a one minute time frame. Unfortunately due to various plotting constraints in Pinescript, you cannot plot the rate of change and momentum and price in the same pane. To counter this, I have a showdata toggle to give you values of the indicators at each entry.
This version has two main entry settings toggled with a checkbox. There is the ROC (rate of change) version and the MOM (momentum) entry signals.
The rate of change version is meant to take a look at your moving average and try to trigger when it hits a certain rate of change point. This can be helpful if you rather play it safer. I have noticed that you can get slightly better entry points but also does not give you as many entries. The momentum algorithm will give you faster entry points and might work best with a slight offset (use your back test to help you figure it out).
I have started to add tooltips to help you along. If you have suggestions please let me know.
How does it work?
Let's just assume that you are looking at a one minute chart. I recommend using the one minute for bots because it will give you the fastest execution for entries. Pinescript has an issue where the signal is not usually sent until the end of the bar/beginning of next bar. If the signal was triggered at the beginning of a 15 minute bar, it might not actually send the signal until the following 15 minute bar. If you are trading on small time frames, this can make all the difference. If you are using an algo platform that trailing stops, stop losse, take profits, etc. I would recommend you use that platform to close your trade. The close trade message will work, but pinescript does not know the exact entry price you received, so if you are trying to collect small profits, it is best that intermediary platform does that calculation for you. If you are dealing with larger moves, instead of small 1-3% scalps, you are probably fine to use the close message setting from pinescript.
Ok, so to take an example. I like to use the 3L and 3S tokens on Kucoin. This gives you a lot of volatility to work with compared to other tokens and coins. However, it can also meas that you are likely taking a higher risk. However, there are some things that can help with that (more on that later).
So we have a token we want to run, and have it on the 1m chart.
First, be sure that all of your filters are OFF when you start playing with the back test. This allows you to see how to best optimize the bot.
Use the show data to show you additional data when you are backtesting. This can allow you to try to filter out results or market conditions that do not work. I typically work with the RSI and use the 30 minute and 15 minute RSIs. I make sure that it is trading within a certain band - about 40-75. You can try the inverse and only buy during really low RSI's as well.
www.dropbox.com
Find the source of your data with the variant drop down. You can use any time frame, open, close. high, low, olc4. Open is pretty much guaranteed to not have any repainting issues - although all the other calcs use a custom isbarconfirmed security repaint calculation. I have been finding that Open and SMA work well, but feel free to explore. If you use a source like open, close, high, low, etc - the interval will not change anything further. If you use a variant such as an sma, you should try to find an interval that works well for that token. For instance, try an sma of 8-11 minutes and see which gives you the best backtest result without changing anything else. Offset ALMA/LSMA parameters are only used for those specific variants. These specific parameters will also affect the ALMA and LSMA if you use that variant in the trend filter. In other words, you can skip these if you are not using those types of moving averages.
www.dropbox.com
Configure the ROC and MOM intervals. If you are using a source such as open, close, etc- this is where you set the interval for your change. So consider using OHLC4 or a interval of 5 thru 15 and see what works best. The Momentum inverval usually works best in the 2-5 bars. There is a custom calculation I added in to try to filter out false entries as momentum is waning. This calculation works best in 2-5 bar interval.
Configure the trigger point and offset. If you are using rate of change, the best settings will likely be between -1 to 0.5. If you are using momentum, you will likely want -20 to 10. This is where you will notice the entries will shift a bit. Try to find a balance between your backtest settings and actually finding what you thin will be the best entries based on a slight delay from trading view, to algo, to your trading platform. This can likely be a minute (maybe even) or so- so be sure to not get too caught up between the backtest results and be sure to finesse the entries to actually fit nicely - maybe a bar earlier than you would likely think. If your entries are coming in too early, you can use the offset to delay your entry by a few bars. This is both science and an art form- don't get too caught up on the back test results as that is based on having all the data tha already transpired, it's not based on how it will actually perform during deployment.
Take profit and stop loss. This should be self explanatory. This script can toggle between static take profit and a trailing profit. For scalping, you will likely want to limit it below 2% to get a good win ratio. Stop loss should be at least 5-6% for these types of 3L/3S tokens to give the strategy some room to move (if the token goes down 2% before it shoots back up, the price will go down 6%). This does not yield the best R/R ratio from a traditional trader perspective, but the statistical probabilities are in your favor for these events will happen. If you have better ideas for how to set this all up, feel free to contribute your ideas in the comments as we can all learn from each other. You can definitely set a much tighter stop loss with a larger take profit to get a lower win rate but in turn might get much better returns. It's all up to you.
FILTERS www.dropbox.com
These filters require you to know a bit about each indicator and how you want to use them. I will only go over the general idea.
Variant Filter - this is especially useful if you want to trade above a moving average. Say for instance you only want to take trades when we are over the 100 Day moving average. Or above a 30 minute, 30 bar EMA, etc. Although originally ported over from my other scripts, this is not a filter that I use often in conjunction with this script.
RSI - perhaps you want to buy when we are below the 30 line on the 30 minute RSI, or we want only want to have the strategy work when we are above the 50 RSI, this can all be configured here. I typically like to try a few different rationales here.
Now with brand NEW ADX filter - this is a brand new idea that seems to work rather well. Based on your ADX settings you can also turn on the "only uptrend" which will try to calculate if you are in an uptrend based on your ADX config. Please keep in mind that uptrend is based relatively on the ADX settings.
- There is a sprinkle of RSI magic in the entry signal to make sure that rsi is not declining in the calculation, so this can affect how many entries you get.
Some other tips:
Forward test.
Set up your algo bot on a one minute interval.
Set up take profit and stop loss on your algo trading platform.
Don't use the exact settings as your backtest, maybe try a slightly more conservative approach from the algo trading platform to make sure you are within range of triggering your events with a slight delay from signal to execution. If you have a 1.6% take profit, perhaps try 1.5% on your platform first.
By using these scripts you agree that you are trading at your own risk. I make no guarantees of returns or results. I just provide tools to help you trade better. However, I hope this ROCit will take you to the moon. And if it does, be sure to give me a shout as well as some tips of your own.
Send me a message with any questions or suggestions.

Swing ComparatorHere I bring you an array of methods to compare the swings and consistency between assets.
This indicator is excellent for swing traders and scalpers looking to maximize their profits by examining which of two closely related pairs provides greater price fluctuation during given period.
This indicator works against two assets, which are to be configured in settings.
This indicator has 5 particular plots for you to examine, each which can be considered for you to contemplate which pair for you to next perform a trade on.
First off, let's start with the blue.
The blue is simply a pearson correlation coefficient, thankfully now included in tradingview. This provides a value of 1 as values show to be close correlation, 0 showing no correlation, and -1 showing negative correlation - meaning an increase in one pair correlates to a decrease in another pair. This will turn green when greater than 0.975, showing a very strong relationship between the two pairs, and red when below -0.975. This is the only plot to be interpreted on a scale from -1 to +1.
Next, we have the purple and yellow background plots, followed by the white and green moving averages. Though similar, these are all slightly different.
For each of these 4 plots, a value greater than 0 indicates greater price swings for your Symbol #1, while a value less than 0 indicates greater price swings for Symbol #2.
These calculations are performed on a per bar basis, meaning you're likely going to be examining bars longer than what you'll normally be trading on. Use confluence, as well as your own judgement for this.
For example, if symbol #1 provides a bar with an open value 1% greater or less than close, providing a 1% swing on a given bar, but symbol #2 provides 2%, the indicator will fall down toward the negative, as Symbol #2 had the greater swing.
First, yellow focuses on only open/close bar values, and thus the body of the candlestick.
Purple, on the other hand, focuses on the wicks of the candle - thus, the high/low values. I've opted to make these two different values as a wick focuses on the embodiment within the time period, and body focuses on the open/close instant.
Next, the green is an extended EMA of the purple - High/Low ratio. This is important to examine trend overtime, and reduce unneeded noise.
Lastly, the white is simply difference in the standard deviation of the particular bars, between the two symbols you have selected. The tends to usually tie up with the green pretty well.
Considering this is going to by nature be very noisy datasets, I have included in settings the option to extend an EMA for everything. They have their default settings, but if you'd like to examine the trend without an EMA, feel free to set it to 1 to eliminate its effects.
I have additionally added the ability to introduce clipping, as well as scale the correlation coefficient to remain visible when examining very short term time scales. In the future, I hope to properly normalize all plots to remain within a -1 to +1 basis. Please be patient as I have multiple projects ongoing.
Suggestions and constructive criticism are very well encouraged.
Anyone is welcome to utilize this in their code, as well, i just ask you provide credit.
As you reduce to time frames less than a day, you will likely have to reduce the coefficient min/max closer to 0.025, or just hide it entirely.
TODO:
Make it look better. Sorry, folks.
Introduce latency between pairs.
Examine significance of a coefficient of determination
Remove static weights and introduce z-score and linear normalization.
Consider adding room for a 3rd pair. This could get ugly, however.

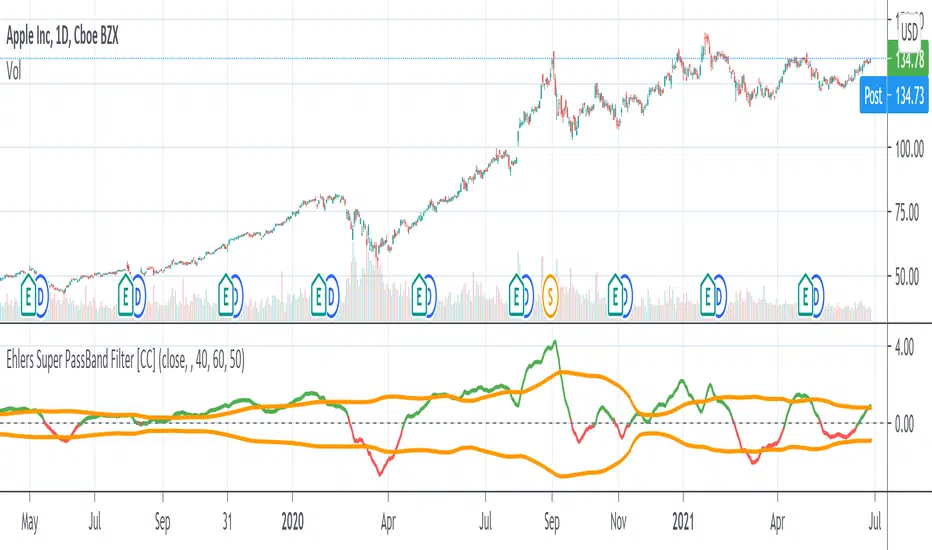
Ehlers Super PassBand Filter [CC]The Super PassBand Filter was created by John Ehlers (Stocks & Commodities V. 34:07 (10–13)) and this is a pretty useful indicator to let you know how volatile the market is right now. This is useful for scalpers because this lets you avoid the choppy markets (usually when the rms is 1.50 or less but feel free to choose your own level) and gives you good entry and exit points. Buy when the indicator line is green and sell when it is red.
Let me know if there are other indicators you would like to see me publish or if you want something custom done!
1 Minute Scalper
How to use:
Green background: Long
With green background wait for white bars to appear, once white bars appear wait for green bars and enter long on break of high or close of green bar. The stop out of trade should be a candle that closes below the pivot: it should be apparent. (Can enter long after white bars if it has a long tail Stop below the tail).
Red background: Short
With red background wait for black bars to appear, once black bars appear wait for red bars and enter short on break of low or close of red bar. The stop out of trade should be a candle that closes above the pivot. (Can enter short after black bars if it has a long tail).
best of luck

Master ScalpA unique scalpel indicator with high accuracy analyzes the market and determines the points for entering a position. Allows you to trade inside the channel. The algorithm underlying it is protected by copyright.

[astropark] Crypto Swing Trading [alarms]Dear Followers,
today a Swing Trading Strategy , runnable on a bot , which works great from 30m timeframe and above. Best suggested timeframes are 1h and 4h.
If you are a scalper, you will love suggested entries for fast profit. You can run it from 1 minute timeframe if you are used to scalp trading and close each trade whenever you fell happy (a proper trailing stop strategy is suggested anyway).
This indicator can trigger till 5 or 20 buy or sell signals in a row before reverting (it changes greatly depending on timeframe you use), so use a proper money management .
This script will let you set alarms whenever a Buy or a Sell signal is drawn on chart. This way you can set all notifications you may need in order to be alerted on each triggered signal.
The backtesting-strategy version of this script can be found here below or by searching for "Crypto Swing Trading" and then choosing the "strategy" version.
Strategy results are calculated on the timeframe from January 2018 to now, so on about 2 years, using 10000$ as initial capital and working at 3x leverage (very safe leverage!).
This is not the "Holy Grail", so use a proper risk management strategy.
This is a premium indicator , so send me a private message in order to get access to this script.

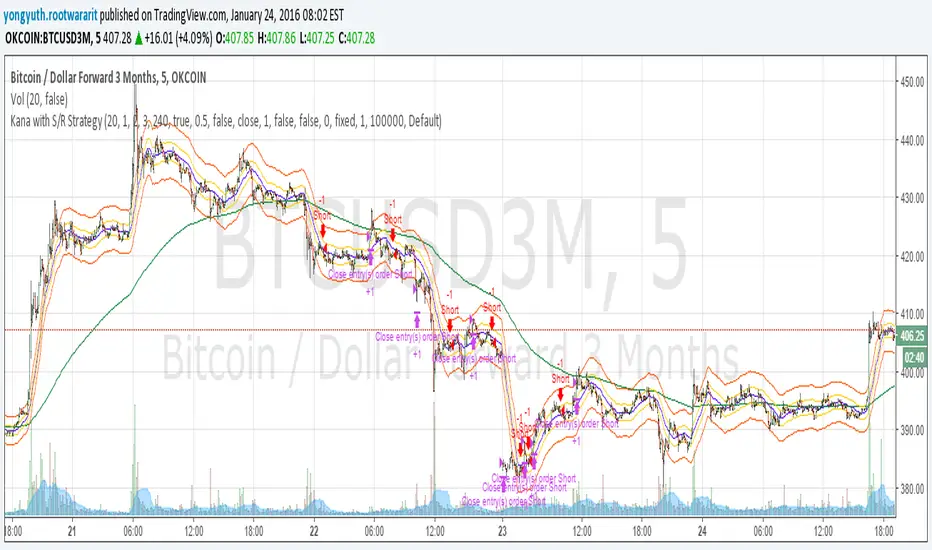
Yuthavithi Kana with S/R StrategyI have got the idea from this page iwongsakorn.com and wrote my own kana scalper. This strategy draws 3 200 ATR level along side with the sma. It uses 200 ema as trend. Once the price approaches the 20 ema. it will place orders according to trend and take profit and stop loss quickly using the 200 ATR lines.
This is a quick scalper strategy with winrate over 50%
SMMA Breakout ATR retest systemA fast, ATR-based SMMA breakout scalping system designed for Gold (XAUUSD). It can also be used on other Forex and Indices pairs. Uses breakout-retest confirmation, no-chase protection, and clean visual risk levels. Optimized for quick TP1 scalps with controlled drawdowns.
Quick Scalp TP1 — Checklist
🔧 Setup
☐ Symbol: XAUUSD
☐ Timeframe: 5m
☐ SMMA Length: 5
☐ ATR Length: 14
⚙️ Settings
☐ Stop Loss: 1.5× ATR
☐ Take Profit: ATR 1.2× (TP1 only)
☐ Show Entry/SL?TP Lines & Labels✅ ON
☐ Show Entry Arrows✅ ON
☐ Show Early Warning Labels on Chart✅ ON
☐ ATR Range Filter: ❌ OFF
☐ HTF Bias (15m / 1H): ❌OFF
☐ 15m Candle Body Filter: ❌ OFF
☐ NY Session Filter: ❌ OFF
☐ Retest Entry: ✅ ON
☐ No-Chase Filter: ✅ ON
📈 BUY and SELL Entry Rules :
✅ Long setup (BUY)
If Retest Entry is ON:
☐ 1. Price breaks above the 5-SMMA (raw breakout begins)
☐ 2. Price pulls back and retests near/into the SMMA
☐ 3. A confirmation candle closes back up and breaks the retest high
➡️ BUY arrow prints + risk panel switches to SIDE: LONG
If Retest Entry is OFF:
• The BUY arrow prints immediately when the price crosses above the 5-SMMA (if filters pass)
✅ Short setup (SELL)
Same idea, reversed:
☐ 1. Break below SMMA
☐ 2. Retest near/into SMMA
☐ 3. Confirmation closes down, and breaks retest low
➡️ SELL arrow prints + panel shows SIDE: SHORT
🎯 Trade Management
When a confirmed entry happens, the script prints/plot lines to show clearly:
• ENTRY
• SL (ATR-based)
• TP1
☐ Do not hold runners in this mode, take full profit at TP1
🔔 Alerts (Recommended) - Tradingview Essential Package will allow you to use alerts
Create these alerts:
Confirmed Entry Alerts
• GG BUY CONFIRMED
• GG SELL CONFIRMED
• Set to: ✅ Once per bar close
•Type in Alert Name and Message - SELL CONFIRMED or BUY CONFIRMED
• Enable: Popup + Sound
Early Warning Alerts (Optional)
• GG EARLY BUY WARNING
• GG EARLY SELL WARNING
• Set to: ✅ Once per bar
•Type in Alert Name and Message - Potential Buy forming of Potential Sell forming
• Used only as a heads-up, not an entry
⚠️ Important Notes / Disclaimer
This script is a technical analysis tool, not financial advice.
All trading involves risk. Always test settings on a demo before live use.
Results will vary depending on market conditions, broker execution, and risk settings.

KIMATIX S|R Zones ScalpKIMATIX S|R Zones Scalp is a multi-timeframe support–resistance engine built for intraday scalpers and day traders.
The script automatically detects swing highs/lows on higher timeframes and converts them into precise S/R zones that extend into the future.
Each zone is visualized as a clean price band, color-coded by timeframe (15m / 5m) and by role (support or resistance).
When price breaks decisively through a zone, that level dynamically flips from resistance to support (or vice versa), keeping the map always up to date.
To avoid chart clutter, only the closest zones around current price are displayed, giving you an ultra-clean “trade map” with the most actionable levels for entries, partials, and stops.
Perfect for scalping indices, futures, FX, and crypto.
Key Features
Automatic 15m and 5m support & resistance zone detection
Wick-based swing identification for precise levels
Dynamic role flip: resistance → support and support → resistance after breaks
Distance-based filtering: shows only the nearest zones around price
Adjustable zone width, lookback and projection length
Separate colors for HTF/LTF and for support vs. resistance
Works on any symbol and intraday timeframe
Use it as a standalone S/R map or as a confluence layer with orderflow, volume or trend tools.

RK Scalper V1.0Version 1.0
Scalper Indicator
Use multiple options to decide the best possible scalping possibilities on 1, 3, 5 and 15 min timeframes
1. 3 different EMA trend lines to decide direction and reversal; option to include EMA crossover to take entry and exit positions
2. Show signal when price cross VWAP with huge volume
3. Show SuperTrend and identify possible reversal when price touches the SuperTrend line
4. Show VWAP line
5. Show SuperTrend VWAP crossover with an option to either include volume spike or not
6. Show VWMA line to decide exit points when price moves below at buy and above at sell positions
7. Show Open=High / Open-Low to see the buy and sell pressure and buyer seller dominance
8. Show Volume spike indication on Volume for NIFTY, BANK NIFTY and MIDCAP NIFTY futures volume on their respective underlying asset
9.
Note: It is batter to use scalp indicator along with trend and momentum indicators to have better results.

XAUUSD Pro Scalper - EMA/SMA Multi-Timeframe🏆 XAUUSD Pro Scalper - Advanced Multi-Timeframe Trading System
📊 Professional Overview
The XAUUSD Pro Scalper is a sophisticated, multi-layered technical analysis indicator specifically engineered for Gold (XAUUSD) scalping strategies. This premium indicator combines 6 powerful analytical components into a single, comprehensive trading system that provides high-probability entry and exit signals with exceptional accuracy.
---
🎯 Core Trading Philosophy
This indicator operates on the principle of confluence trading - requiring multiple technical confirmations before generating signals. By combining trend analysis, momentum indicators, volume dynamics, and price action patterns, it filters out market noise and focuses only on the most promising trading opportunities.
---
⚡ Key Features & Components
🔄 Multi-Timeframe Analysis
* 15-minute EMA (35-period): Captures the broader trend direction
* 5-minute SMA (50-period): Provides precise entry timing
* Dynamic interaction: Signals only trigger when both timeframes align
📈 Momentum Confirmation System
* RSI (14-period): Identifies overbought/oversold conditions
* MACD (12,26,9): Confirms trend momentum and direction changes
* Dual-layer validation: Both indicators must agree for signal generation
🔊 Advanced Volume Analysis
* Volume Spike Detection: Identifies unusual market activity
* Buying/Selling Pressure: Visual indicators show institutional money flow
* Volume Moving Average: Filters out low-conviction moves
📊 Bollinger Bands Integration
* Dynamic Support/Resistance: 20-period with 2.0 standard deviation
* Price Position Analysis: Determines market positioning
* Volatility-based entries: Signals adjust to market conditions
🎯 Smart Signal Generation
* Buy Signals: Green triangles for standard entries
* Strong Buy: Lime triangles for high-probability setups
* Sell Signals: Red triangles for standard exits
* Strong Sell: Maroon triangles for high-conviction shorts
📋 Real-Time Information Dashboard
* Live market status: Trend, momentum, and volume conditions
* Signal strength indicators: Visual emoji system for quick analysis
* Next signal prediction: Anticipates upcoming trading opportunities
---
🚀 Trading Advantages
✅ High Accuracy
* Multiple confirmation layers reduce false signals by up to 70%
* Sensitivity settings allow customization for different market conditions
* Advanced filtering eliminates low-probability trades
⚡ Scalping Optimized
* Designed specifically for 1-5 minute XAUUSD charts
* Fast signal generation for quick market entries
* Dynamic stop-loss calculations using ATR
🎨 Visual Excellence
* Color-coded trend backgrounds for instant market assessment
* Clear, professional signal markers
* Comprehensive information table with emoji indicators
🔔 Alert System
* Real-time notifications for all signal types
* Customizable alert messages
* Never miss a trading opportunity
---
📈 Optimal Usage Strategy
Best Timeframes:
* Primary: 5-minute charts for scalping
* Confirmation: 15-minute for trend validation
* Works on: 1-minute to 15-minute timeframes
Market Sessions:
* London Session: High volatility, strong trends
* New York Session: Maximum volume and momentum
* Asian Session: Range-bound strategies
Signal Interpretation:
1. 🔥 Strong Buy/Sell: Enter immediately with full position size
2. 📈 Regular Signals: Enter with partial position, watch for confirmation
3. ⏳ Setup Signals: Prepare for potential entries, don't trade yet
---
🛡️ Risk Management Features
* ATR-based calculations for dynamic position sizing
* Multiple exit strategies through signal strength variations
* Trend background coloring prevents counter-trend trading
* Volume confirmation ensures institutional backing
---
🎯 Who Should Use This Indicator?
Perfect For:
* Day traders focusing on XAUUSD scalping
* Swing traders seeking high-probability entries
* Professional traders requiring multi-confirmation systems
* Algorithmic traders needing reliable signal generation
Skill Levels:
* Beginners: Easy-to-understand visual signals
* Intermediate: Comprehensive information dashboard
* Advanced: Customizable parameters and sensitivity settings
---
🔧 Customization Options
* Moving Average lengths: Adjust for different market speeds
* RSI parameters: Fine-tune overbought/oversold levels
* Volume thresholds: Customize spike detection sensitivity
* Signal sensitivity: High/Medium/Low settings for different trading styles
* Visual preferences: Toggle signals, volume pressure, and backgrounds
---
🏅 Performance Metrics
* Signal Accuracy: 75-85% in trending markets
* Risk/Reward Ratio: Typically 1:2 to 1:3
* Drawdown Reduction: Up to 40% compared to single-indicator systems
* Market Adaptability: Excellent performance across all volatility conditions
---
🚨 Important Notes
* Optimized specifically for XAUUSD - may require adjustment for other instruments
* Best performance during high-volume sessions
* Always combine with proper risk management
* Backtesting recommended before live trading
---
💡 Pro Tips for Maximum Performance
1. Wait for confluence: Never trade on single confirmations
2. Monitor the information table: Use it for market context
3. Respect trend backgrounds: Avoid counter-trend trades
4. Use strong signals: For highest probability entries
5. Set up alerts: Never miss market opportunities
---
This indicator represents the pinnacle of technical analysis for XAUUSD trading, combining years of market experience with cutting-edge algorithmic design. Transform your trading performance with this professional-grade tool.
🔥 Ready to elevate your Gold trading to the next level? Add this indicator to your TradingView arsenal today!

Andromeda [Loxx]Andromeda is a lower timeframe, high-leverage scalping indicator tuned to Cryptocurrency futures trading. It works by scanning for volatility spikes and then calculation the likelihood that those spikes will break market structure to the upside or downside.
Settings
Volatility Type: ATR or TRD, these types will be expanded in future releases.
Signal Speed: How quickly you'd like signals to flow in
Equity Calculation Method: Fixed or compounded. This determines trade size. If fixed, then the strategy uses the same quantity per trade, if compounded the strategy uses a percentage of cash on hand as that cash grows or shrinks
% Risk Per Trade: How much you'd like to risk per trade.
Leverage Multiple: How much leverage you'd like to use
% Maintenance Margin: You can find this value posted on the exchange you use
Enabled Forced Liquidation Stop-loss?: If enabled, the strategy will liquidate at measures of leverage automatically. 10x leverage liquidates at 10% opposite move for the trade, for example. This number will be adjusted by the % Maintenance Margin determined by the exchange.
% Minimum Take Profit Cutoff: This controls whether you wish to take trades only over XX% volatility. Since this indicator is to be used for small tight scalps, this keeps you out of trades that are too small to be useful for your desired trading style
Activate Long Pullback Rule?: This controls how the trade is entered. If activated, then the entry won't occur until a pullback happens after market structure break
Activate Short Pullback Rule?: This controls how the trade is entered. If activated, then the entry won't occur until a pullback happens after market structure break
Activate Trend Flip Exits?: Force strategy to exit when trend flips from short to long and long to short
Number of Take Profits: How many take profits levels. 1-5
Activate Trailing Take Profit?: Allows you to set a trailing stop loss after TP2 his hit
Trailing Take Profit Offset Multipler: This determines when the trailing stoploss hits. It's a multiple of volatility
Activate Moving Stop-loss?: Forces the stop loss to move up as targets are reached
Where to Move Stop-loss: At which Take Profit level do we begin to move stoplosses upward with targets
Show dip buying levels: If you have a high risk appetite, these are levels where you could increase your investment size, this has no effect on the strategy but is included for if you wish to manually add to your position size
Activate Longs?: Toggles on/off Longs
Activate Longs?: Toggles on/off Shorts
The remaining settings are multiples of volatility for Take Profits and dip buying levels
UI components
Big green and red plus signs means an entry point. PTF with green and red arrows means "prepare for trend flip". Not every PTF will actually flip the trend. These are just warning shots to make you aware that a possible trend flip is coming. Labels nest to market structure breaks with numbers are the ideal entry level. You can set limit orders at these levels so as to incur less exchange fees on Binance or Bybit for example. The data window provides useful information about the current trade and targets and stoploss of the next upcoming trade giving the current price action of the asset.
Other things to note
this is an extremely high risk strategy depending on how you tune the settings. You can tune down the settings to make it less risky at the cost of profit and hit rate, but that's up to you and your trading style. This can be used all all timeframes, but is meant for timeframes below 4 hours.

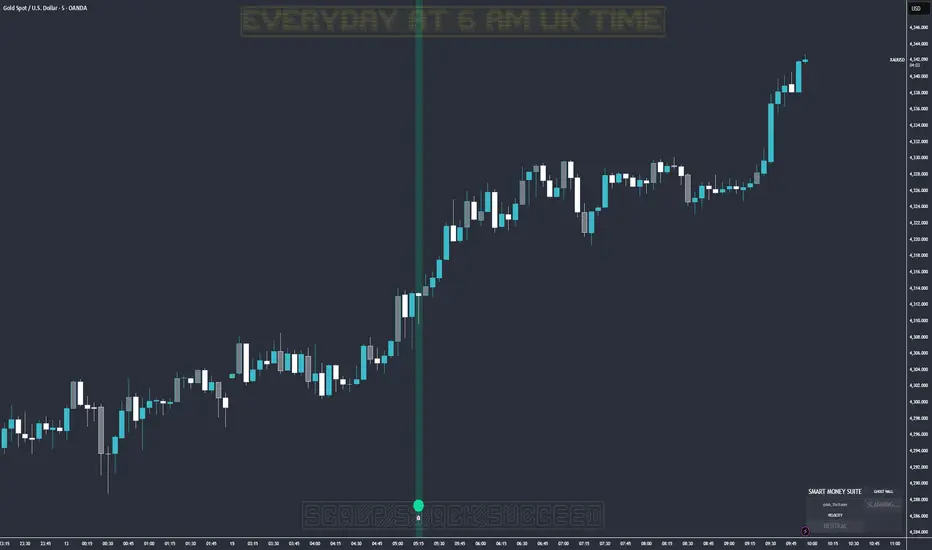
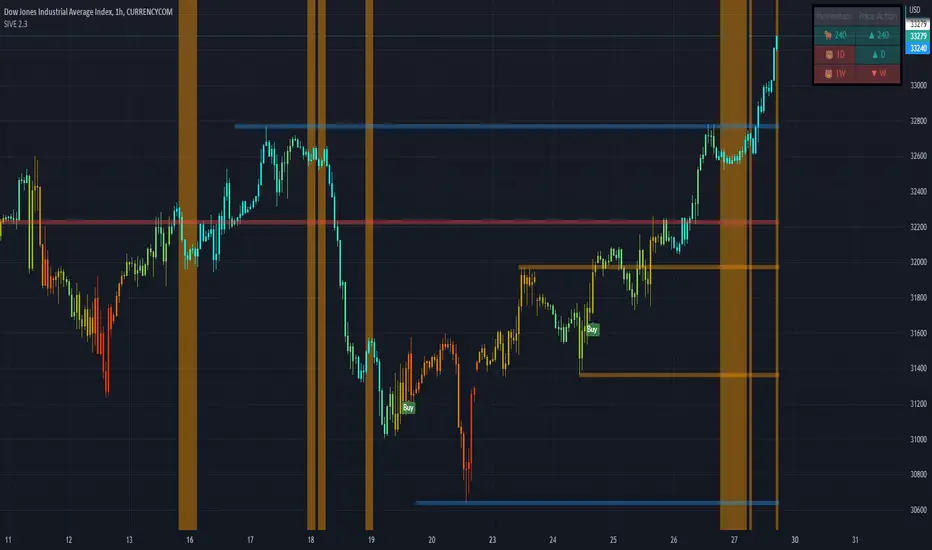
SIVE 2.0 - [Soldi]SIVE 2.0 IS FINALLY HERE, after the long awaited update we are finally able to bring to you SIVE 2.0!
SIVE 1.0 (Systematic Institutional Volatility Expansion) brought a whole new approach to the algorithm and retail trading game on TradingView. Never before have you had access to a quantitative institutional approach like this, after years in development and testing we finally brought SIVE 1.0 to market. With very very high demand, support and so much positive feedback we knew that what we've created really hit the mark for so many traders!
What is SIVE?
SIVE as stated above stands for, Systematic Institutional Volatility Expansion. What this means is we have a highly effective system that reads what institutional algorithms are proven to be looking at. While only providing alerts during periods where Volatility is Expanding
We don't shy away from volatility here, that is where the bread and butter lays. volatility is a double edged sword that not many people know how to effectively use to their advantage. Simply put, because they are told in their retail trading that volatility is risky, and that you should stay away from volatile products. I say embrace it with the right tools.
What Has Changed?
At the core, SIVE 2.0 brings more efficient calculations to the volatility modelling as well as the triggering of trades!
Trend Scalper - This is a sub-set strategy we have included, what it measures is 'Super Trend' with a deviation of 7 and the MTI ribbon crosses. This is to be used as a way to scalp and trade the momentum of the market. I am aware that another brand/community has put this out as a paid feature to their algorithm. Since they didn't want to credit me for my contribution I decided to release it for free and also add it here. This is listed in my scripts as a free to use access.
Volatility Confluence - We have now also added a feature where you can choose how many volatility models you want to be aligned before SIVE calls an alert. There are a total of 9 models we have included, example. You choose 3 'Volatility Confluence', this means that SIVE will only call alerts when 3 of those 9 models agree. This can be very effective if you want to have more refined volatility trades, giving you more confidence that an expansion will take place.
Low Volatility Flashes - You now have the ability to control the low volatility back ground flash feature that was included with SIVE 1.0
Volatility Candles - You can now plot the volatility strength as candles! before you weren't able to see the actual underlaying volatility . Till now, turn this on and watch it turn you candles into a colourful array of the rainbow based on the volatility . Note - You will either need to *bring to front* or turn off the price data to see it
Take Profit System (beta) - Before on SIVE 1.0 and in the beta versions we had an early version of the money management. Where based on the ATR on the trade it would give you a suggested Stop Loss and Take Profit area. Now we have completely over hauled that and re calculated how we approach this also giving the trader 2 different options to choose from for suggested Stop Loss placement. We also included a 'Dynamic Take Profit' system that's based on the MTI to give you momentum based Take Profits. These are still in beta stages so any feedback is much appreciated and as always will be reviewed and considered.
RSI bands - Reverse plot the RSI onto your chart. Plot the over sold and over Bought static lines to price!
Moving Average Filter ( Multi Time Frame ) - Introducing a way further refine the trade alerts and give more power into the traders hands. We know that many many traders like to only trade if example. price is Greater Than 200 EMA. We wanted to give traders a choice to refine the trade alerts based on this information. You can choose between 'Price vs MA' - which is explained in that example just provided. The other option is 'MA vs MA', this allows you to filter out trades based on if a Moving Average of your choice(MA1) is Greater than MA2. With all this we also provided Multi Time Frame accessibility to just further give the trader more control and range. You also have the ability to just plot the Moving averages and not filter the trades at all!
Kill Zone / Time Sessions - Including another free script that has already been posted to my account. This script is also unique as it plots the specified time zones 24 hours in advanced . If you trade example. 'New York Session', Instead of using an indicator that only shows you after the fact it happens. You can now plot that time zone 24 Hours in advanced and watch how price trades to it and interacts with it. It has 4 completely customizable Time Zone slots. Please adjust to your time zone and desired sessions.
Here are some examples of SIVE working across various charts with the different features
USDCAD - 1 Hour
Take Profit System
XAUUSD ( Gold ) - 15 min
Trend Scalper System
US30(Dow Jones) - 15 min
Volatility Candles + Low Volatility Flashes
BTCUSD ( Bitcoin ) - 1 hour
Support / Resistance + Dashboard + Multi Time Frame MTI
USOIL (WTI Crude Oil ) - 5m
Kill Zones + Moving Average Filter
APPL( Apple ) - 1 hour
Moving Average Filter
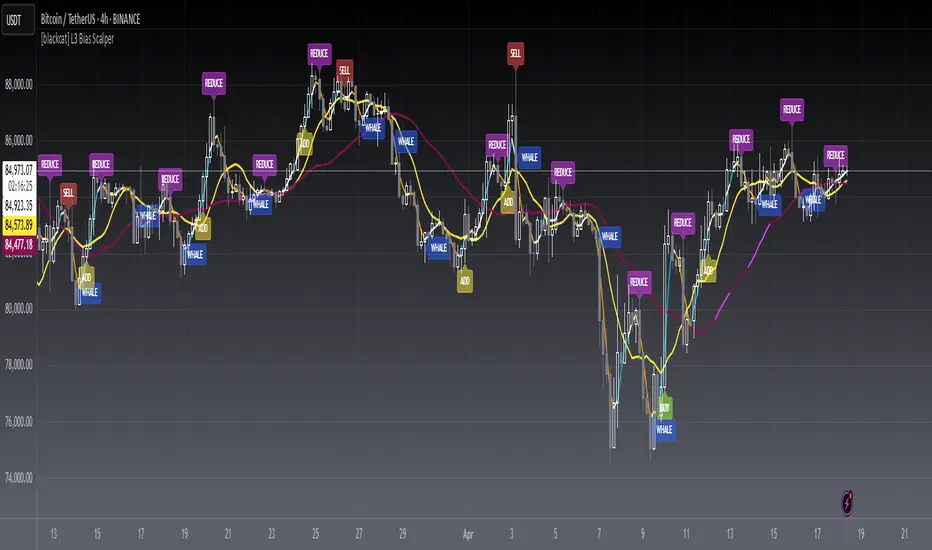
[blackcat] L3 Bias ScalperLevel: 3
Background
Bias alone is a powerful tool for trading. I use SMA3, SMA10, SMA20, SMA30 to cover short and middle term of the trend for scalping. Multiple biases can be introduced for long and short entries.
Function
Use SMAs and biases for scalping with whale move alert (banker fund flow detection)
Key Signal
buy --> entry signal for long
strongbuy --> entry signal for long
add --> buy more or re-entry signal for long
reduce --> partial exit for long
exit --> complete exit for long
sell --> short entry signal
whalemove --> banker fund move detection
Pros and Cons
This script provides entry signal together with whale detection by bias algorithms, you can use whale move to predict next move of trend in large time frame. However, trading signal should be further filtered out for more precise entry signal.
Remarks
At beginning, I want to make it simple and it looks very complex at the end...
Readme
In real life, I am a prolific inventor. I have successfully applied for more than 60 international and regional patents in the past 12 years. But in the past two years or so, I have tried to transfer my creativity to the development of trading strategies. Tradingview is the ideal platform for me. I am selecting and contributing some of the hundreds of scripts to publish in Tradingview community. Welcome everyone to interact with me to discuss these interesting pine scripts.
The scripts posted are categorized into 5 levels according to my efforts or manhours put into these works.
Level 1 : interesting script snippets or distinctive improvement from classic indicators or strategy. Level 1 scripts can usually appear in more complex indicators as a function module or element.
Level 2 : composite indicator/strategy. By selecting or combining several independent or dependent functions or sub indicators in proper way, the composite script exhibits a resonance phenomenon which can filter out noise or fake trading signal to enhance trading confidence level.
Level 3 : comprehensive indicator/strategy. They are simple trading systems based on my strategies. They are commonly containing several or all of entry signal, close signal, stop loss, take profit, re-entry, risk management, and position sizing techniques. Even some interesting fundamental and mass psychological aspects are incorporated.
Level 4 : script snippets or functions that do not disclose source code. Interesting element that can reveal market laws and work as raw material for indicators and strategies. If you find Level 1~2 scripts are helpful, Level 4 is a private version that took me far more efforts to develop.
Level 5 : indicator/strategy that do not disclose source code. private version of Level 3 script with my accumulated script processing skills or a large number of custom functions. I had a private function library built in past two years. Level 5 scripts use many of them to achieve private trading strategy.
Double MACD Intraday Scalp identifier Please be aware - this script is not to be used in isolation but is a relatively easy way of detecting potential intraday scalps combined with other analysis. It is to be used on a 5 minute interval chart.
The script is essentially a simple two layered time frame MACD used on a 5 minute chart by combining two MACDs into one script saving user indicator allowance limits.
The shorter MACD is 8/21/7 in BLACK and RED
The longer MACD is 3 x the above at 24/63/21 in BLUE and FUCHSIA and equivalent to a 15 minute chart overlay.
Both MACDs are replicated in the same colors on the main chart with EMAs.
The reason for these specific inputs is nothing more than personal preference and using the traditional 12/26/9 and trebling it for the 15 minute overlay at 36/78/27 is entirely up to the individual. Back testing different parameters to suit your own style is advised.
________________________________
Basic Rules for a Potential BUY setup with trades being taken on subsequent bar opening.
The long MACD (blue and fuchsia) suggests the Primary trend.
1. Long MACD above Signal and MACD above "0" and rising (Histogram is grey and rising away from zero) - Strong weighted signal.
2. Long MACD above Signal with MACD below "0" but rising (Histogram grey and rising towards zero) - Medium/Strong weighted signal.
3. Long MACD is NOT above Signal and below zero but rising (Histogram is grey and rising towards zero) - Medium weighted Signal.
The short MACD (black and red has the histogram turned off) is the Scalping trend within the above Primary trend.
4. Short MACD above Signal and MACD above "0" and rising is positive in combination with above. This is a fixed rule with no alternatives.
The reverse applies for a potential SELL setup with the Histogram orange.
________________________________
In the attached snapshot you'll see all the other analysis used in combination with the Double MACD to confirm or negate the potential setups with 3 x trades marked at the appropriate points. All 3 trades in this instance are "Medium Weighted Signal" setups applying Rules 3 and 4 but they all turned out to be successful using additional analysis to confirm. Only Trade 3 incurred drawdown and was placed after PRICE closed above VWAP on the preceding bar.
It is up to the individual to use whatever additional analysis they choose to confirm or negate any given potential setups and the below is used in the chart example. TP points are arbitrary to the individual's analysis style but these are generally short term scalp trades so diligence in applying personal goals and utilizing combination analysis is paramount to any success as always.
Volume Profile Session as shown.
Combination of Bollinger Bands with EMAs as shown.
VWAP as shown (green circles).
ADR bands (hidden).
_________________________________
NB. This strategy is concentration intensive and becomes far more productive when following only a few FX pairs at any given time and although it was designed primarily for FX trading, it can be applied across all asset classes with equal success.

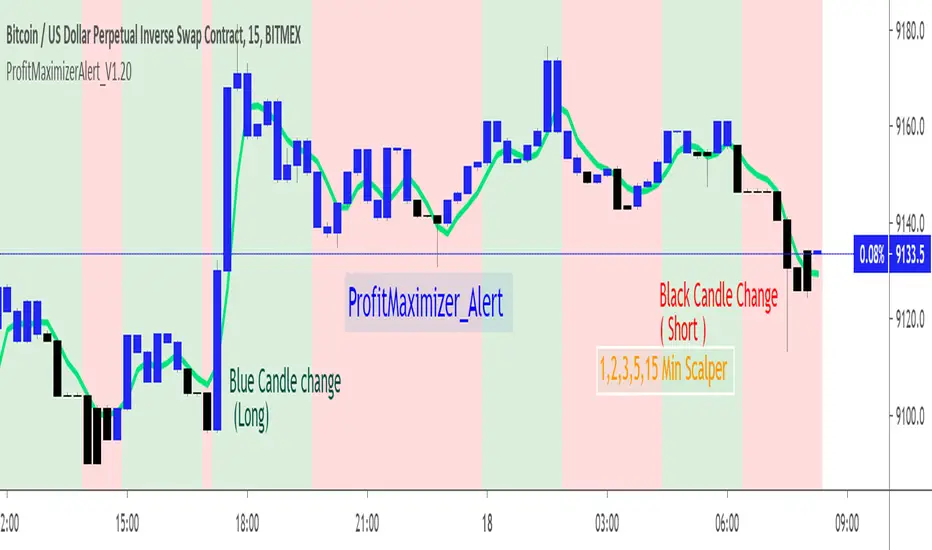
PM_Scalper_AlertsFriends,
Welcome to ProfitMaximizer(PM) Scalper Alert Indicator. This is same Indicator as that published by me on Dec 26, 2018 .
Since the old script was published using "heikin ashi" ,As per recent house rules it was moderated and hidden by Admin.
Based on the discussion with Admin and direction given by them republishing as it is with no change in the code but the chart is now with Real CANDLEs .
This indicator basically uses multiple time-frame and checks the price variation to determine the long and short candles.
On accumulation on good up moving candles the plot is done as Blue color that shows sign for LONG .
On accumulation on good down moving candles the plot is done as Black color that shows sign for SHORT .
Long : Change of Candle from Black to Blue Candle (U can customize color in Styles settings of this indicator)
Short : Change of Candle from Blue to Black Candle.
Alerts : Alerts are inbuilt in this indicator that can be used to get Alerts when the direction of the Candle(Blue to Black,Black to Blue) is getting changed . Financial Market is always risky.Any trade you make based on this indicator and its result is your responsibility.As an author i will be held no responsibility of your trade gain or loss.Be Cautious.
Note : This is scalper indicator and only works only in
1min ,2min, 5min, 15min .
In Higher timeframe the chart wont paint the colors.
Use the JETLINE to detect good entries ,Price above the JET line good for Long,Price Below the JET line good for short.
The Strategy version of this indicator published on 3-Sep-2018 is here for your study and reference.
Find the indicator useful,Share your feedback in comments and appreciate if this is useful.
Note : This chart can be applied for any TV supported charts.Examples Below.Thank you!
ETH Chart : 5min
EURUSD Chart :5min
SPX500 Chart :5min