PeBAS €$ 5minMy EuroDollar Scalper Script for the 5min Timeframe.
Script analyses the Trend and scalp only in the right direction. In short-trends we scalp short, in long-trends we scalp long. Everything else is stupid, i think.
Take care, there is no Stop Loss.
The script does not repaint!
Try it and think about your positions. Start for example with very small positions and get a ffeling for the script. And enjoy!
Take care in have the sunshine in your heart ... :)
In den Scripts nach "scalp" suchen

KIMATIX VWAP/EMA System (by ASCE)**KIMATIX VWAP/EMA System (by ASCE)**
A precision-built intraday framework for momentum, structure, and liquidity timing.
**Why this indicator exists**
Most traders see movement, but not context. They enter too late, chase momentum, or fade reversals without understanding where institutional players react.
This tool solves that problem by combining two of the most powerful structural concepts in intraday price discovery:
Trend alignment through EMAs
Liquidity reaction zones through VWAPs
Together, they provide directional clarity, timing, and trade location.
**Core Components**
**Three Trend EMAs**
• **EMA 7** – Microtrend and momentum speed
• **EMA 23** – Intraday trend leadership
• **EMA 50** – Higher-timeframe structure anchor
This trio shows how price accelerates, slows, flips bias, or compresses.
**Three Volume-Weighted Average Prices**
• **Daily VWAP** – Primary scalper reference point
• **Weekly VWAP** – Bias filter and intermediate balance zone
• **Monthly VWAP** – High-impact “magnet” where major reactions occur
VWAP represents the fair value where volume is distributed.
When price taps, rejects, or reclaims these levels, liquidity flow shifts — ideal for scalp-to-swing entries.
**What it helps you see**
• When price is aligned with or diverging from trend
• Where momentum will expand or fail
• Which levels larger participants defend
• Where the highest-probability reaction zones form
This is not a signal tool — it is a structure and decision-making framework used by professional intraday traders.
**How to use it**
1. **Trade with VWAP alignment** – expect reactions at daily/weekly/monthly VWAPs
2. **Follow EMA flow** – when EMAs compress or flip, momentum changes
3. **Look for price interaction** – rejection, reclaim, or breakthrough of a VWAP often leads to fast moves
Ideal for scalping, day-trading, futures, FX, indices, crypto, and metals.
**Customization**
Colors for each EMA and each VWAP can be personalized, allowing alignment with your charting workflow.
**Final Notes**
This system gives you the *context* most traders miss — where trend meets liquidity.
Use it as a roadmap to understand where price *should* react and when momentum is likely to shift.

Confluence Engine [BullByte]CONFLUENCE ENGINE
Multi-Factor Technical Analysis Framework
OVERVIEW
Confluence Engine is a multi-dimensional technical analysis framework that evaluates market conditions across five distinct analytical pillars simultaneously. Rather than relying on a single indicator or signal source, this tool synthesizes Structure, Momentum, Volume, Volatility, and Pattern analysis into a unified scoring system that identifies high-probability trading opportunities when multiple technical factors align.
The core philosophy behind this indicator stems from a fundamental observation: isolated signals frequently fail, but when multiple independent analytical methods agree, the probability of a successful trade increases substantially. This indicator was developed after extensive research into why traders often receive conflicting signals from different indicators on their charts, leading to analysis paralysis and poor decision-making.
THE PROBLEM AND SOLUTION
The Problem:
Most traders use multiple indicators independently, often receiving contradictory signals. One indicator says "buy" while another says "wait." This creates confusion and leads to missed opportunities, premature entries based on incomplete analysis, difficulty quantifying how strong a setup actually is, and inconsistent decision-making across different market conditions.
The Solution:
Confluence Engine addresses this by providing a single, unified score (0-100) that represents the aggregate strength of a trading setup. Instead of mentally weighing five different indicators, traders receive a clear numerical score indicating setup quality, visual tier classification (ULTRA, HIGH, STANDARD), specific identification of which factors are strong or weak, and actionable guidance on what to watch for next.
THE FIVE ANALYTICAL DIMENSIONS
Each dimension was selected because it measures a fundamentally different aspect of market behavior:
STRUCTURE ANALYSIS
Evaluates price position relative to key levels and recent swing points. Markets respect structure - previous highs, lows, and areas where price reversed. This dimension identifies when price interacts with these critical levels and measures the quality of that interaction.
What it detects: Price approaching or sweeping swing highs/lows, reclaim patterns after false breakouts, EMA alignment and trend structure, exhaustion after extended moves.
MOMENTUM ANALYSIS
Measures the underlying strength and direction of price movement. Strong moves are characterized by momentum preceding price. This dimension evaluates whether momentum supports the current price direction.
What it detects: Oversold/overbought conditions with reversal potential, momentum divergence states, directional movement strength (ADX-based), momentum shifts before price confirmation.
VOLUME ANALYSIS
Volume validates price movement. Significant moves require participation. This dimension measures current volume relative to recent averages to determine if market participants are genuinely committing to the move.
What it detects: Volume spikes confirming price action, below-average volume warning of weak moves, climactic volume at potential reversals, volume confirmation of rejection patterns.
VOLATILITY ANALYSIS
Markets alternate between compression (low volatility) and expansion (high volatility). This dimension identifies these phases and recognizes when compression is likely to resolve into directional movement.
What it detects: Volatility squeeze conditions (Bollinger inside Keltner), squeeze release direction, ATR expansion indicating breakout potential, compression duration for timing breakouts.
PATTERN ANALYSIS
Candlestick patterns reflect the battle between buyers and sellers within each bar. This dimension evaluates the quality and context of reversal and continuation patterns.
What it detects: Engulfing patterns with quality scoring, hammer and shooting star formations, rejection wicks indicating trapped traders, pattern confluence with other factors.
WHAT MAKES THIS INDICATOR ORIGINAL Not a mashup
This is NOT a mashup of indicators displayed together. The Confluence Engine represents an integrated analytical framework with the following unique characteristics:
Unified Scoring System: All five dimensions feed into a proprietary scoring algorithm that weights and combines their signals. The output is a single 0-100 score, not five separate readings.
Multi-Factor Gate: Beyond just scoring, the system requires a minimum number of factors to be "active" (meeting their individual thresholds) before allowing signals. This prevents signals based on one extremely strong factor masking four weak ones.
Regime-Aware Adjustments: The engine detects the current market regime (trending, ranging, volatile, weak) and automatically adjusts factor weights and score multipliers. A structure signal means something different in a trending market versus a ranging market.
Adaptive Risk Management: Take-profit and stop-loss levels are not static. They adapt based on current volatility, market regime, and signal quality - providing tighter targets in low-volatility environments and wider targets when volatility expands.
Liquidity Sweep Detection: A distinctive feature that identifies when price has swept beyond a swing high/low and then reclaimed back inside. This pattern often indicates stop hunts followed by reversals.
Signal Quality Tiers: Rather than just "signal" or "no signal," the engine classifies setups into tiers. ULTRA (80+) represents highest probability setups with all factors aligned. HIGH (70-79) represents strong setups with multiple factors confirming. STANDARD meets minimum threshold for acceptable setups.
HOW THE SCORING WORKS
Each of the five factors generates a raw score from 0-100 based on current market conditions. These raw scores are then weighted according to the selected trading style (Balanced, Scalper, Swing, Range, Trend), adjusted based on current market regime detection, modified by higher timeframe alignment (if enabled), bonused when multiple factors exceed their activation thresholds simultaneously, and multiplied by session factors (if session filter is enabled).
The result is a final Bull Score and Bear Score, each ranging from 0-100, representing the current strength of long and short setups respectively.
Signal Generation Requirements:
- Score meets minimum threshold (configurable: 60-95)
- Required number of factors are "active" (default: 3 of 5)
- Market regime is not blocked (if blocking enabled)
- Higher timeframe alignment passes (if required)
- Cooldown period from last signal has elapsed
UNDERSTANDING THE DASHBOARDS
Main Dashboard (Top Right)
The main dashboard displays real-time scores and market context:
LONG Score - Current bullish setup strength (0-100) with quality tier displayed
SHORT Score - Current bearish setup strength (0-100) with quality tier displayed
Regime - Current market state showing TREND UP, TREND DN, VOLATILE, RANGE, or WEAK
HTF - Higher timeframe alignment showing BULL, BEAR, NEUT, or OFF
Squeeze - Volatility state showing SQZ (in squeeze), REL+ (bullish release), REL- (bearish release), or NORM
Gate - Factor count versus requirement, for example 4/3 means 4 factors active with 3 required
Sweep L/S - Liquidity sweep status for long and short setups
ATR% - Current ATR as percentile of recent range indicating relative volatility
Vol - Current volume relative to 20-period average
R:R - Current risk-reward ratio based on adaptive TP/SL calculations
Trade - Active trade status and unrealized profit/loss percentage
Analysis Dashboard (Bottom Left)
The analysis dashboard provides actionable guidance:
Signal Readiness - Visual progress bars showing how close each direction is to generating a signal
Blocking Factors - Identifies which specific factor is weakest and preventing signals
Recommended Action - Context-aware guidance such as WATCH, WAIT, MANAGE, or SCAN
Watch For - Specific events to monitor for setup completion
Opportunity Level - Overall market opportunity rating from EXCELLENT to VERY POOR
Timing - Contextual timing guidance based on current conditions
Status Bar (Bottom Center)
Compact view displaying Long Score, Gate Status, Current State, Gate Status, and Short Score in a single row for quick reference.
Dashboard Size - Auto Mode Explained
When Dashboard Size is set to "Auto", the indicator intelligently adjusts text size based on your current chart timeframe to optimize readability:
Auto-Sizing Logic:
1-Minute to 5-Minute Charts → Tiny
- Lower timeframes show more bars on screen
- Tiny text prevents dashboard from obscuring price action
- Recommended for scalping and high-frequency monitoring
15-Minute Charts → Small
- Balanced size for intraday trading
- Readable without being intrusive
1-Hour to Daily Charts → Normal
- Standard size for most trading styles
- Optimal readability for swing trading
Weekly and Monthly Charts → Large
- Larger text for position trading
- Fewer bars visible so space is available
Manual Override:
You can override auto-sizing for any dashboard individually:
- Dashboard Size (All): Sets master size applied to all dashboards
- Main Dashboard Size: Override for top-right dashboard specifically
- Analysis Panel Size: Override for bottom-left panel specifically
- Status Bar Size: Override for bottom-center bar specifically
Example Use Case:
Trading on 5m chart (default = Tiny) but you have good eyesight and large monitor:
- Set "Dashboard Size (All)" to "Small" or "Normal" for better readability
- Individual dashboards will use your override instead of auto-sizing
Recommendation:
Start with Auto mode and only adjust if dashboards are too large or too small for your monitor/eyesight.
UNDERSTANDING SIGNAL LABELS
When a signal generates, a label appears with trade information:
Minimal Style Example:
LONG 85
Shows tier icon, direction, and score only.
Detailed Style Example:
ULTRA LONG
Score: 85
Entry: 50250.50
TP1: 50650.25
TP2: 51500.75
SL: 49850.25
R:R 1:2.5
Regime: TREND UP
HTF: BULL
Tier Icons Explained:
indicates ULTRA quality with score 80 or higher
indicates HIGH quality with score between 70 and 79
indicates STANDARD quality with score meeting minimum threshold
UNDERSTANDING TRADE ZONES
When a signal generates, visual elements appear on the chart:
Entry Line (Purple) marks the entry price level
TP1 Line (Blue Dashed) marks the first take-profit target
TP2 Line (Cyan Dashed) marks the final take-profit target
SL Line (Orange Dotted) marks the stop-loss level
Trade Zone Box shows shaded area from SL to TP2
These elements extend forward as price progresses. When TP1 is hit, its line becomes solid to indicate achievement. When the trade completes at either TP2 or SL, all elements are cleaned up and the entry label converts to a compact ghost label for historical reference.
Exit Labels Explained:
+X.XX% indicates first target reached with partial profit secured
+X.XX% indicates full target reached with maximum profit achieved
-X.XX% indicates stop-loss triggered
TP1 Hit, SL... indicates stopped out after TP1 was already hit (optional display)
OPPOSITE SIGNAL HANDLING
When market conditions shift dramatically, the engine may generate a signal in the opposite direction while an existing trade is active. This represents a significant change in confluence and is handled automatically:
Automatic Trade Reversal Process:
1. Detection: New signal triggers opposite to current trade direction (e.g., SHORT signal while LONG trade is active)
2. Current Trade Closure:
- All visual elements (entry line, TP/SL lines, trade zone) are deleted
- Current trade is marked as closed
3. Entry Label Conversion:
- The detailed entry label is converted to a compact ghost label
- Ghost label shows direction + score (e.g., "LONG 75")
- Marked with "OPP" outcome to indicate opposite signal closure
- Moved to a non-interfering position below/above price
4. New Trade Initialization:
- Fresh entry label created for new direction
- New TP1, TP2, SL levels calculated based on new signal quality
- Trade zone and price lines drawn for new trade
Example Scenario:
You enter a LONG trade at score 72. Price moves sideways for 8 bars, then market structure breaks down. Confluence shifts heavily bearish with a sweep reclaim bear + momentum + volume spike, generating a SHORT signal at score 81. The engine automatically:
- Closes the LONG trade
- Converts "LONG 72" entry label to a small ghost label
- Opens new SHORT trade at current price
- Displays new SHORT entry label with full trade details
Trading Implication:
This behavior ensures the engine is always aligned with the highest-probability direction based on current confluence. It prevents you from holding a position when all five factors have flipped against you.
Note: This does NOT happen for every small score change. The opposite signal must meet all signal generation requirements (minimum score, gate pass, regime check, HTF alignment) before triggering. Typically occurs during strong trend reversals or major support/resistance breaks.
EXAMPLE TRADE : LONG
Instrument and Exchange: Bitcoin / TetherUS (BTC/USDT) on Binance
Timeframe: 5-minute
Timestamp: Nov 27, 2025 12:39 UTC
Indicator Script: Confluence Engine v1.0
Trade Type: Long (Example Trade)
Setting Used: Default
Signal Details:
- Tier: HIGH
- Score: 70
- Entry Price: 90040.70
- TP1 Target: 90868.63
- TP2 Target: 92110.52
- Stop Loss: 89325.94
- Risk Reward: 1:2.9
Trade Outcome:
- TP1 hit after 12 bars (+0.95%)
- TP2 hit after 28 bars (+2.85%)
- Total gain: +2.85% on full position
EXAMPLE TRADE : SHORT with Dashboard Explanation and interpretation
Instrument and Exchange: Ethereum / U.S. Dollar (ETH/USD) — Coinbase
Timeframe: 1-hour
Timestamp (screenshot): Nov 28, 2025 16:41 UTC
Indicator Script: Confluence Engine v1.0
Trade Type: Short (Example Trade)
Setting Used: Default
Signal Details
-Tier: STANDARD (STD)
-Score: 64
-Entry Price: 3037.26
-TP1 Target: 2981.61 (-55.65 pts)
-TP2 Target: 2898.12 (-139.14 pts)
-Stop Loss: 3099.79 (+62.53 pts)
-Risk:Reward: ≈ 1 : 2.2 (TP2/SL)
-Market Context at Signal
-Regime: TREND UP (contextual regime at time of signal) — mixed environment for shorts
-HTF Alignment: OFF (no higher-timeframe confirmation)
-Gate Status: 3 / 3 (minimum factor groups active — gate passed)
-Squeeze Status: NORM (no active compression breakout)
-Volume: ~1.8× average (elevated participation)
-ATR%: 57% (elevated volatility)
Analysis Dashboard Reading (what the user sees)
-Long Readiness: Needs +36 points to qualify.
-Short Readiness: Needs +11 points to qualify (closer but not auto-entering).
-Blocking Factors: Structure = 0 — the single decisive blocker preventing fresh signals.
-Opportunity Level: VERY POOR (roughly 20 / 100) — low quality environment for adding positions.
-Timing: Wait for better setup (do not add new positions).
-Trade Outcome (screenshot moment)
-Trade state: Active SHORT (opened earlier).
-Live P&L (snapshot): +0.14% (managing trade).
-TP1/TP2: Targets shown on chart (TP1 2981.61, TP2 2898.12). Not closed yet at screenshot.
-Visuals: Entry label, TP/SL lines and trade zone are displayed and being extended while trade is active.
Interpretation
The engine produced a standard short (Score 64) while the market showed elevated volume and volatility but no HTF confirmation. Although the Gate passed (3/3), Structure = 0 blocks the indicator from issuing fresh entries — this is intentional and by design: one missing factor (structure) is enough to prevent new signals even when other factors look supportive. The currently open short is being managed (partial targets and SL visible), but the system's recommendation is to manage the existing trade only and not open new shorts until structure or HTF alignment improves.
Why this example matters (teaching point)
-Gate ≠ Go: Gate pass (factor count) alone does not force fresh trades — the system enforces additional checks (structure, regime, HTF) to avoid lower-quality setups.
-Volume & Volatility are necessary but not sufficient: High volume and wide ATR create movement but do not replace structural validation.
-Active trade vs new entries: The script will continue to manage an already open trade but will not create a new signal while a blocking factor remains. This prevents overtrading and reduces false positives.
-Practical trader actions shown by the example
-Manage existing SHORT only: Trail to breakeven if TP1 is taken; scale out at TP1; hold remaining if price respects trend and structure reclaims.
-Do not add fresh positions: Wait for Structure > 0 or a HTF alignment that lifts the block.
-Watch for signals that matter: Sweep reclaim, HTF alignment turning bullish for shorts (i.e., HTF changes to BEAR), or a squeeze release with volume spike — these can clear the blocker and validate new entries.
RECOMMENDED TIMEFRAMES
For Scalping on 1m, 5m, or 15m charts: Use higher factor thresholds and shorter cooldowns. The faster pace requires stricter filtering.
For Day Trading on 15m, 30m, or 1H charts: This provides a balance of signal frequency and reliability suitable for most active traders.
For Swing Trading on 1H, 4H, or Daily charts: Expect higher quality signals with longer hold periods and fewer false signals.
For Position Trading on Daily or Weekly charts: Focus on ULTRA signals only for maximum conviction on longer-term positions.
Higher Timeframe Alignment Recommendations:
When trading 5m, use 1H as your HTF
When trading 15m, use 1H or 4H as your HTF
When trading 1H, use 4H or Daily as your HTF
When trading 4H, use Daily as your HTF
The general rule is to select an HTF that is 4 to 12 times your trading timeframe.
TRADING STYLE PRESETS
Balanced (Default)
Equal weighting across all five factors at 20% each. Suitable for most market conditions and recommended as starting point.
Scalper
Emphasizes Volume at 30% and Volatility at 30%. Designed for quick in-and-out trades on lower timeframes where immediate momentum and volatility expansion matter most.
Swing Trader
Emphasizes Structure at 30% and Momentum at 30%. Focuses on catching larger moves where trend direction and key levels are paramount.
Range Trader
Emphasizes Structure at 35% and Pattern at 25%. Optimized for sideways markets where support/resistance levels and reversal patterns dominate.
Trend Follower
Emphasizes Momentum at 40%. Designed for trending markets where staying with the dominant direction is the priority.
QUALITY MODE SETTINGS
Custom Mode
Set your own minimum score threshold. Lower thresholds between 60 and 65 generate more signals but with lower average quality. Higher thresholds of 75 or above generate fewer but higher-quality signals.
High Quality Mode
Uses minimum score of 70. Recommended for most users as it filters out marginal setups while still providing reasonable signal frequency.
Ultra Only Mode
Uses minimum score of 80 for maximum selectivity. Only the highest-conviction setups generate signals. Recommended for swing and position traders or during uncertain market conditions.
REGIME DETECTION
The engine continuously evaluates market conditions and classifies them into five states:
TREND UP
Characteristics: Strong ADX reading with EMAs aligned in bullish order
Trading Implications: Long signals receive score boost while short signals are suppressed. Momentum factor gains additional weight.
TREND DN
Characteristics: Strong ADX reading with EMAs aligned in bearish order
Trading Implications: Short signals receive score boost while long signals are suppressed. Momentum factor gains additional weight.
VOLATILE
Characteristics: High ATR percentile, wide Bollinger Bands, elevated volume
Trading Implications: Both directions remain viable but wider stops are recommended. Volume factor gains additional weight.
RANGE
Characteristics: Low ADX reading, narrow Bollinger Bands, low ATR percentile
Trading Implications: Structure signals are emphasized while momentum signals are suppressed. Pattern recognition becomes more important.
WEAK
Characteristics: Unclear or mixed conditions that do not fit other categories
Trading Implications: Reduced confidence in all signals. Consider waiting for clearer market conditions.
Filter Mode Options:
Off - Regime is detected and displayed but no score adjustments are applied
Adjust Scores - Automatically modifies factor weights based on current regime
Block Weak Regimes - Prevents signals from generating when regime is RANGE or WEAK
VOLATILITY SQUEEZE DETECTION
A volatility squeeze occurs when Bollinger Bands contract inside the Keltner Channel, indicating reduced volatility and potential energy building for a breakout.
Squeeze States Explained:
SQZ with bar count (example: SQZ 15)
Indicates currently in squeeze for the displayed number of bars. A score penalty is applied during this phase because compression represents uncertainty about direction.
REL+ (Release Bullish)
Indicates squeeze has released with price above the basis line. Score bonus is applied for long setups as this often precedes strong upward moves.
REL- (Release Bearish)
Indicates squeeze has released with price below the basis line. Score bonus is applied for short setups as this often precedes strong downward moves.
NORM (Normal)
No active squeeze detected. Standard scoring applies.
Trading Implication:
Squeeze releases often produce strong directional moves. The engine detects both the squeeze duration and the release direction, awarding bonus points to signals that align with the release. Longer squeeze duration often corresponds to more powerful breakouts.
LIQUIDITY SWEEP DETECTION
Markets often sweep beyond obvious support and resistance levels to trigger stops before reversing. The engine detects these patterns:
Bullish Sweep Reclaim
Price sweeps below recent swing low, triggering stop losses, then reclaims back above the swing low. This often indicates smart money accumulation after retail stops are collected.
Bearish Sweep Reclaim
Price sweeps above recent swing high, triggering stop losses, then reclaims back below the swing high. This often indicates smart money distribution after retail stops are collected.
Sweep Status in Dashboard:
RCL (Reclaim) - Reclaim has been confirmed. This receives highest structure score as the pattern is complete.
PND (Pending) - Sweep has occurred and price is near the level but full reclaim not yet confirmed. Watching for completion.
ACT (Active) - Sweep is currently in progress with price beyond the swing level.
Dash (-) - No sweep activity detected.
MULTI-FACTOR GATE SYSTEM
Beyond overall score, the engine counts how many individual factors meet their activation threshold.
Example Calculation:
Structure score 45 with threshold 35 equals ACTIVE
Momentum score 25 with threshold 30 equals INACTIVE
Volume score 50 with threshold 35 equals ACTIVE
Volatility score 40 with threshold 30 equals ACTIVE
Pattern score 35 with threshold 30 equals ACTIVE
Result: 4 of 5 factors are active
If minimum required factors is set to 3, this example passes the gate and receives a 4-factor bonus.
Gate Bonuses:
4 factors active adds 8 points to final score (default setting)
5 factors active adds 15 points to final score (perfect confluence)
Purpose:
This mechanism prevents scenarios where one extremely high factor score masks four weak factors. A score of 75 with only 2 active factors is less reliable than a score of 70 with 4 active factors.
ADAPTIVE RISK MANAGEMENT
Take-profit and stop-loss distances adjust dynamically based on three inputs:
Volatility Influence (default 40% weight)
Low ATR percentile produces tighter targets
High ATR percentile produces wider targets
This ensures stops are not too tight in volatile conditions or too wide in calm conditions.
Regime Influence (default 30% weight)
Trending market with aligned signal produces extended targets
Ranging market produces contracted targets
Volatile regime produces wider stops for protection
Score Influence (default 30% weight)
ULTRA signals (high conviction) receive extended targets
STANDARD signals receive standard targets
Higher conviction justifies larger profit expectations.
You can configure the weight of each influence in settings to match your trading style.
SESSION FILTER (Optional Feature)
When enabled, the engine applies score multipliers based on the trading session:
Asian Session (default 0.9x multiplier)
Characterized by lower volatility and ranging tendency. Score reduction reflects reduced opportunity.
London Session (default 1.1x multiplier)
Characterized by high volatility and trend initiation. Score boost reflects increased opportunity.
London/NY Overlap (default 1.2x multiplier)
Characterized by highest liquidity and strongest moves. Maximum score boost reflects peak trading conditions.
New York Session (default 1.05x multiplier)
Characterized by volatility but typically after initial moves have occurred.
Configure your UTC offset in settings to align session detection with your chart timezone.
ALERT SYSTEM
The indicator provides comprehensive alerts with dynamic data:
Signal Alerts:
- ULTRA Long Signal with full trade details
- ULTRA Short Signal with full trade details
- HIGH Long Signal with key levels
- HIGH Short Signal with key levels
- Any Long Signal with basic info
- Any Short Signal with basic info
Trade Management Alerts:
- TP1 Reached with profit percentage
- TP2 Full Target with total profit
- Stop Loss Hit with loss percentage and status
Technical Event Alerts:
- Squeeze Release
- Liquidity Sweep
- Perfect Confluence
- Regime Change
All alerts include actual calculated values such as score, entry price, target levels, stop level, and risk-reward ratio at the time of trigger.
AUTOMATIC SETTINGS VALIDATION
The indicator performs comprehensive validation when first loaded on a chart. If configuration errors are detected, a warning label appears on the chart with specific guidance.
Critical Errors (Prevent Signal Generation):
ULTRA threshold must exceed HIGH threshold
- Example error: HIGH = 75, ULTRA = 70
- Fix: Ensure ULTRA threshold is higher than HIGH threshold
- Default safe values: HIGH = 70, ULTRA = 80
Minimum factors cannot exceed 5
- The gate requires 3 to 5 factors (you cannot require 6 of 5 factors)
- Fix: Set minimum active factors to 3, 4, or 5
TP2 multiplier must exceed TP1 multiplier
- Example error: TP1 = 3.0 ATR, TP2 = 2.0 ATR
- Fix: Ensure TP2 (final target) is farther than TP1 (partial target)
- Default safe values: TP1 = 2.0, TP2 = 5.0
Swing lookback minimum is 3 bars
- Liquidity sweep detection requires at least 3 bars to identify swing highs/lows
- Fix: Increase swing lookback period to 3 or higher
ATR period minimum is 5 bars
- ATR calculation requires sufficient data for accuracy
- Fix: Increase ATR period to 5 or higher (14 recommended)
Higher timeframe must be larger than chart timeframe
- Example error: Trading on 1H chart with MTF set to 15m
- Fix: Select HTF that is 4-12x your chart timeframe
- Example: If trading 15m, use 1H or 4H as HTF
Warnings (Signal Generation Continues):
Score threshold below 50 generates many signals
- Lower thresholds increase signal frequency but reduce quality
- Recommendation: Use minimum 60 for active trading, 70+ for swing trading
Cooldown below 3 bars may cause signal clustering
- Very short cooldowns can produce multiple signals in quick succession
- Recommendation: Use 5+ bars for lower timeframes, 3+ for higher timeframes
Validation Label Display:
When errors are detected, a label appears at the top of the chart showing:
SETTINGS QUICK REFERENCE
Signal Quality Section:
Quality Mode: High Quality recommended for most users
Custom Minimum Score: Used when Quality Mode is set to Custom (range 30-95)
HIGH Threshold: Score required for HIGH tier classification (default 70)
ULTRA Threshold: Score required for ULTRA tier classification (default 80)
Regime Engine Section:
Enable Regime Detection: Activates automatic market state classification
Filter Mode: Off, Adjust Scores, or Block Weak Regimes
ADX Strong Threshold: ADX level indicating strong trend (default 25)
ADX Weak Threshold: ADX level indicating ranging conditions (default 15)
Show Regime Background: Displays subtle background color for current regime
Liquidity and Squeeze Section:
Enable Liquidity Sweep Detection: Activates sweep and reclaim pattern detection
Swing Lookback Period: Bars used to identify swing highs and lows (default 8)
Reclaim Threshold: Percentage of range price must reclaim after sweep (default 15%)
Enable Volatility Squeeze Detection: Activates Bollinger/Keltner squeeze detection
Keltner Channel Multiplier: Width multiplier for Keltner Channel (default 1.5)
Squeeze Penalty: Points subtracted during active squeeze (default 25)
Squeeze Release Bonus: Points added on squeeze release (default 20)
Enable Multi-Factor Gate: Requires minimum factors active before signaling
Minimum Active Factors: How many factors must meet threshold (default 3)
Individual Factor Thresholds: Customize activation threshold for each factor
4-Factor Bonus: Points added when 4 of 5 factors active (default 8)
5-Factor Bonus: Points added when all 5 factors active (default 15)
MTF Confluence Section:
Enable MTF Confluence: Activates higher timeframe trend analysis
Higher Timeframe: Select timeframe for trend alignment (recommend 4-12x chart TF)
Require HTF Alignment: Block signals opposing higher timeframe trend
Show HTF EMAs: Display higher timeframe EMA 21 and EMA 50 on chart
Trading Style Section:
Enable Style Weighting: Activates factor weight adjustments based on style
Trading Style: Balanced, Scalper, Swing Trader, Range Trader, or Trend Follower
Custom Weights: Individual weight sliders when fine-tuning is needed
Session Filter Section:
Enable Session Filter: Activates session-based score multipliers
Your UTC Offset: Your timezone offset for accurate session detection
Session Multipliers: Individual multipliers for Asian, London, New York, and Overlap sessions
Risk Parameters Section:
ATR Period: Period for Average True Range calculation (default 14)
TP1 ATR Multiple: First target distance as ATR multiple (default 2.0)
TP2 ATR Multiple: Final target distance as ATR multiple (default 5.0)
SL ATR Multiple: Stop loss distance as ATR multiple (default 2.0)
Enable Adaptive TP/SL: Activates dynamic adjustment based on conditions
Volatility Weight: Influence of ATR percentile on adaptive calculation (default 40%)
Regime Weight: Influence of market regime on adaptive calculation (default 30%)
Score Weight: Influence of signal score on adaptive calculation (default 30%)
Appearance Section:
Color Theme: Matrix (green/red), Dark (modern dark), or Light (clean light)
Label Detail: Minimal (score only), Standard (key info), or Detailed (full breakdown)
Dashboard Size Controls: Master size and individual overrides for each dashboard
Show Trade Zones: Display shaded box from SL to TP2 for active trades
Show TP/SL Labels: Display price labels on target and stop lines
Show Trailing Exit Labels: Display exit label when stopped after TP1 hit
Show Main Dashboard: Toggle main dashboard visibility (top right)
Show Analysis Dashboard: Toggle analysis panel visibility (bottom left)
Show Status Bar: Toggle compact status bar visibility (bottom center)
Performance Section:
Performance Mode: Reduces visual elements on lower timeframes automatically
Max Ghost Labels: Maximum historical signal labels to retain (default 50)
Signal Cooldown: Minimum bars between signals in same direction (default 5)
Enable Script Alerts: Controls whether alert() calls fire automatically (default ON)
- ON: Dynamic alerts with calculated values fire automatically
- OFF: alert() suppressed, alertcondition() still available for manual creation
- Use OFF when testing settings or monitoring multiple instruments visually
- Toggle per-chart for selective alert coverage across watchlist
Show Factor Markers: Display shapes on chart when 3, 4, or 5 factors align
Show Score Breakdown: Display detailed factor scores table in debug panel
Show Regime Debug: Display regime state and ADX value in debug panel
Show MTF Debug: Display higher timeframe status in debug panel
DEBUG MODE AND FACTOR MARKERS
The indicator includes optional debug tools for traders who want deeper insight into the scoring mechanics and factor analysis. These features are disabled by default to keep the chart clean but can be enabled in the Debug Mode settings group.
FACTOR MARKERS
When "Show Factor Markers" is enabled, visual shapes appear on the chart indicating confluence states:
Perfect Confluence (5/5 Factors Active)
A circle appears below the bar for bullish or above the bar for bearish setups. This represents maximum confluence where all five analytical dimensions meet their activation thresholds simultaneously. A small label showing "5/5" also appears. This is a rare occurrence and typically precedes the highest quality signals. Background color shifts to highlight this exceptional alignment.
Strong Confluence (4/5 Factors Active)
A diamond shape appears below the bar for bullish or above the bar for bearish setups. This represents strong confluence with four of five factors active. A label showing "4/5" appears when this state is first achieved. This level of confluence is associated with high-quality setups.
Ready Confluence (3/5 Factors Active)
A triangle appears below the bar (pointing up) for bullish or above the bar (pointing down) for bearish setups. This represents the minimum confluence level required when gate is set to 3 factors. No label appears for this level to reduce visual clutter.
Confluence Background
When factor markers are enabled, a subtle background color appears indicating the current confluence state. Stronger colors indicate higher confluence levels. Bullish confluence shows green tints while bearish confluence shows red tints.
Purpose of Factor Markers:
These markers help traders visualize when confluence is building before a signal triggers. You might see a 4/5 diamond appear one or two bars before the actual signal, giving you advance notice that conditions are aligning. This can help with preparation and timing.
DEBUG PANEL (Bottom Right)
When any debug option is enabled, a debug panel appears in the bottom right corner of the chart providing detailed scoring information.
Score Breakdown Table
When "Show Score Breakdown" is enabled, the panel displays:
Factor column showing Structure, Momentum, Volume, Volatility, and Pattern
Bull column showing raw score (0-100) for each bullish factor
Bear column showing raw score (0-100) for each bearish factor
Weight column showing current percentage weight for each factor
Below the factor rows :
FINAL row shows the calculated final Bull and Bear scores after all adjustments
Adj row shows total adjustments applied including gate bonus, squeeze adjustment, and exhaustion adjustment with positive or negative sign
This breakdown allows you to see exactly which factors are contributing to the score and which are lagging. If you notice Structure consistently low, you know to wait for better price positioning relative to swing levels.
Regime Debug
When "Show Regime Debug" is enabled, the panel displays:
Current regime state (TREND UP, TREND DN, VOLATILE, RANGE, WEAK)
Current ADX value driving the regime classification
This helps you understand why certain score adjustments are being applied and verify the regime detection is working as expected for current market conditions.
MTF Debug
When "Show MTF Debug" is enabled, the panel displays:
Current MTF alignment status (BULL, BEAR, NEUT)
The higher timeframe being analyzed
This confirms the higher timeframe data is being read correctly and shows you the trend bias from the larger timeframe perspective.
Using Debug Mode Effectively
For Learning: Enable all debug options when first using the indicator to understand how scores are calculated and what drives signal generation.
For Optimization: Use score breakdown to identify which factors are consistently weak in your chosen market and timeframe. This can inform whether to adjust factor thresholds or switch trading styles.
For Troubleshooting: If signals seem inconsistent, enable debug to see exactly what values the engine is working with. This helps identify if a specific factor is behaving unexpectedly.
For Live Trading: Disable debug features to keep chart clean and reduce visual distraction. The main dashboards provide sufficient information for trade execution.
Debug Settings Summary:
Show Factor Markers - Displays shapes on chart when 3, 4, or 5 factors align. Useful for seeing confluence build before signals trigger.
Show Score Breakdown - Displays detailed table with all raw factor scores, weights, and adjustments. Useful for understanding exactly how final score is calculated.
Show Regime Debug - Adds regime state and ADX value to debug panel. Useful for verifying regime detection accuracy.
Show MTF Debug - Adds higher timeframe status and timeframe to debug panel. Useful for confirming MTF data is loading correctly.
PERFORMANCE CONSIDERATIONS
On lower timeframes such as 1-minute and 5-minute charts, the indicator creates visual elements including labels, lines, and boxes that may impact performance on slower devices.
Performance Mode automatically reduces visual elements, optimizes calculation frequency, and limits historical ghost labels when enabled.
Configure Max Ghost Labels (default 50) to control how many historical signal labels are retained on the chart.
NON-REPAINTING DESIGN
Signal Integrity:
All entry and exit signals generate only on confirmed (closed) bars using barstate.isconfirmed checks. This ensures signals do not appear and disappear during bar formation.
Higher Timeframe Data:
MTF analysis uses request.security with lookahead disabled (barmerge.lookahead_off) to prevent future data from influencing current calculations.
Visual Elements:
Lines, boxes, and labels for active trades update in real-time for monitoring purposes but this visual updating does not affect signal generation logic. Entry decisions are made solely on confirmed bar data.
DISCLAIMER
Trading financial instruments involves substantial risk of loss and is not suitable for all investors. Past performance does not guarantee future results. This indicator is a technical analysis tool provided for educational purposes only. It does not constitute financial advice, trading recommendations, or solicitation to buy or sell any financial instrument.
The developer makes no representations regarding the accuracy of signals or the profitability of trading based on this indicator. Users assume full responsibility for their trading decisions and should conduct their own analysis before entering any trade.
Always use proper risk management. Never risk more than you can afford to lose. Consider consulting a qualified financial advisor before making trading decisions.
VERSION HISTORY
v1.0 - Initial Release
- Five-factor confluence scoring system
- Regime detection and automatic adaptation
- Liquidity sweep and reclaim detection
- Volatility squeeze state machine
- Multi-factor gate with bonus system
- Adaptive risk management
- Comprehensive alert system
- Three dashboard display panels
- Session filter with multipliers
- Multiple trading style presets
- Theme customization options
Developed by BullByte
Pine Script v6
2025

Binary Options Gold Scalping [TradingFinder] 1 & 5 Min Strategy🔵 Introduction
In binary options trading, price movements are often driven by the market’s tendency to reach key liquidity zones. These areas include Liquidity, Fair Value Gaps (FVGs), and Order Blocks (OBs), zones where a large number of pending orders are concentrated.
When price reaches one of these zones, it typically enters a Liquidity Sweep phase to collect available liquidity. After this process, the market often reacts sharply, either reversing direction or continuing its move with renewed momentum. Understanding this cycle forms the foundation of most smart money-based binary options strategies.
In this analytical approach, a Liquidity Sweep is usually seen as a False Breakout, often recognized through a distinctive candle confirmation pattern. The pattern appears when price briefly breaks a level to trigger stops, then quickly returns within range. This formation is one of the most reliable reversal signals for short-term trades and plays a central role in many binary options strategies.
After a liquidity sweep, price often returns to Fair Value Gap (FVG) or Order Block (OB) areas to restore balance in the market. These are zones where institutional orders are typically placed, and reactions around them can create high-probability trade setups. In binary options trading, this quick reaction following a sweep and retrace into an FVG or OB provides one of the best entry opportunities for short-term trades.
By combining the concepts of Liquidity Sweep, Fair Value Gap, and Order Block, traders can build a precise binary options strategy based on smart money behavior, allowing them to identify market reversals with greater confidence and enter at the optimal moment.
Bullish Setup :
Bearish Setup :
🔵 How to Use
This indicator is built on the Smart Money Concept (SMC) framework and serves as a core tool for accurately detecting Liquidity Sweeps, Order Blocks, and Fair Value Gaps in binary options trading.
Its logic is simple yet powerful : when price reaches high-interest liquidity zones and shows reversal signs, the indicator issues an entry signal immediately after a Candle Confirmation is complete.
Signals only activate when both the market structure and the candle confirmation pattern align, ensuring high accuracy in spotting genuine reversals.
🟣 Long Position
A bullish signal appears when the market, after a downward move, reaches sell-side liquidity zones where liquidity has built up below previous lows. In such conditions, a bullish Order Block or Fair Value Gap often exists in the same region, acting as a potential reversal point.
When the indicator detects the presence of liquidity, an imbalance zone (FVG), and a valid candle confirmation simultaneously, it triggers a green Call signal.
In a binary options strategy, the best entry moment is immediately after the candle confirmation closes, as this is when the probability of reversal is highest and the market tends to react strongly within the next few candles.
In the example below, after the liquidity sweep and candle confirmation, price quickly rallied, resulting in a Binary Win setup.
🟣 Short Position
A bearish signal occurs when price, after an upward move, reaches an area of buy-side liquidity and collects liquidity above recent highs. At this stage, the market is typically overbought and ready to reverse. If a bearish Order Block or Fair Value Gap exists in the same area and a candle confirmation pattern forms, the indicator displays a red Put signal.
This setup is highly accurate because multiple structural confirmations occur simultaneously : liquidity has been absorbed, price is rebalancing, and the confirmation candle has closed.
In binary options trading, this is the ideal moment to enter a Put (Sell) position, as the price reaction to the downside is usually quick and decisive.
In the example chart, the indicator generated a bearish signal right after the candle confirmation and completion of the liquidity sweep, price then dropped within minutes, resulting in another Binary Win.
🔵 Settings
Time Frame : Select the desired timeframe for analysis. If left blank, the indicator uses the chart’s current timeframe.
Swing Period : Defines how many candles are used to detect structural pivots (swing highs and lows). A higher value increases accuracy but reduces the number of signals.
Candle Pattern : Enables candle-based confirmation logic. When turned on, the indicator issues signals only if a valid reversal pattern is detected. You can also choose the confirmation filter strength, tighter filters show fewer but more precise signals.
🔵 Conclusion
A deep understanding of Liquidity Sweeps, Order Blocks, and Fair Value Gaps can make a decisive difference between ordinary and professional traders in the binary options market.
This indicator, combining smart money logic with candle confirmation, is one of the most precise tools for detecting true market reversals. When liquidity is collected and structural reversal signs emerge, the indicator automatically recognizes the price reaction and generates a reliable Call or Put signal.
Using this tool alongside market structure analysis and FVG detection allows traders to enter high-probability setups while filtering out false breakouts. For that reason, this binary options strategy is not only suitable for short-term trading but also valuable for understanding deeper smart-money behavior across timeframes.
Ultimately, success with this system comes down to two key principles: understanding the logic of the liquidity sweep and waiting for the candle confirmation to close. When these two conditions align, the indicator can pinpoint the best entry points with remarkable precision, helping you build a structured, intelligent, and profitable binary options strategy.

M Farm Scalper v4"M Farm Scalper v2" Trading Indicator on TradingView
Overview
This script uses a combination of indicators to help attempt the best view of when to exit and enter markets. The author has seen that usage of multiple indicators combined provided value and create profit.
1. Improved Signal Reliability
Combining swing highs and lows with Swing Failure Patterns (SFP) increases the reliability of the signals. Each indicator contributes different insights into market behavior:
Swing Highs and Lows: These help identify key support and resistance levels.
Swing Failure Patterns: These provide early warning signs of potential trend reversals when price fails to maintain new highs or lows.
2. Comprehensive Market Analysis
Using multiple indicators allows for a more comprehensive analysis of market conditions:
Trend Analysis: Swing highs and lows can indicate the overall trend direction.
Reversal Signals: SFPs highlight potential reversal points where the current trend might be weakening.
3. Enhanced Signal Strength
The script not only detects basic SFPs but also evaluates their strength by considering the number of failures within a specified range:
Strength of SFPs: By quantifying the strength of SFPs, the script can distinguish between weak and strong reversal signals. This helps traders prioritize stronger signals, reducing false positives.
4. Visual and Alert-based Trading
The combined use of these indicators improves both visual analysis and automated alert systems:
Visual Representation: Plotting different characters for swing points and SFPs makes it easier for traders to quickly interpret the chart.
Alerts: Automated alerts for specific conditions (like swing high/low failures) enable traders to respond promptly to significant market movements without constantly monitoring the charts.
5. Flexibility and Customization
The script includes parameters that allow traders to customize the behavior of the indicators based on their trading preferences:
Customization of Lookback Period (swingHistory): Traders can adjust this to fine-tune the sensitivity of swing point detection.
Selective Plotting (plotSwings, plotFirstSFPOnly, plotStrongerSFPs): These options provide flexibility in how much information is displayed on the chart, preventing clutter and focusing on relevant signals.
6. Minimized Noise and False Signals
By using a combination of indicators, the strategy aims to filter out market noise and reduce the likelihood of false signals:
Confluence of Signals: When multiple indicators align to provide a signal, it generally indicates a higher probability setup, thus reducing the chances of acting on false or less significant market moves.
7. Contextual Market Understanding
Combining indicators offers a more contextual understanding of market dynamics:
Market Context: Identifying both support/resistance levels (via swing points) and potential trend reversals (via SFPs) provides a fuller picture of market conditions, allowing traders to make more informed decisions.
Conclusion
Combining multiple indicators in the "M Farm Scalper v2" script is a strategic choice designed to enhance the robustness, reliability, and actionable quality of the trading signals. This approach leverages the strengths of each indicator to provide a well-rounded, comprehensive trading tool that aids traders in identifying high-probability trade setups and minimizing the risk of false signals.
ChatGPT can make mistakes. Check important info.
Introducing "M Farm Scalper v2" – an advanced proprietary trading indicator designed exclusively for the TradingView platform. This tool excels in identifying key swing points and Swing Failure Patterns (SFPs), offering traders unique visual and auditory cues to enhance decision-making. It's particularly tailored for the 5-minute timeframe but adaptable to suit a variety of trading styles.
Unique Features
Advanced Swing Point Detection: Leverages a sophisticated algorithm to detect swing highs and lows, integrating predictive analytics to forecast potential market reversals.
Dynamic Swing Failure Pattern Analysis: Employs a real-time analysis combining price action and volume data to pinpoint bullish and bearish reversal opportunities with high precision.
Innovative Visual and Auditory Cues: Features unique, easy-to-understand icons such as animals and fruits to represent market signals, simplifying complex market data into actionable insights.
Functionality
"M Farm Scalper v2" is crafted to deliver:
Configurable Parameters: Users can adjust settings including Swing History, visibility of swing points, and sensitivity for detecting stronger SFPs, making it highly customizable to fit individual trading strategies.
Clear, Actionable Outputs: Designed to offer straightforward visual signals directly on the trading chart, facilitating quick and effective decision-making.
Compliance and Originality
Original Integration of Features: This script combines several analytical techniques into a cohesive unit that surpasses the capabilities of existing open-source scripts in both originality and functionality.
Justification for Closed-Source: The proprietary nature of the algorithms and the unique method of data presentation are maintained as closed-source to protect the integrity and effectiveness of the tool, providing users with a reliable competitive advantage.
Application Instructions
To apply "M Farm Scalper v2," add it from the TradingView "Indicators" menu by searching for our script. Adjust the customizable settings as per your trading requirements and observe how the indicator’s outputs make market dynamics easy to interpret and act upon.
Chart Presentation
The accompanying chart is presented cleanly, focusing solely on the outputs of "M Farm Scalper v2." Each visual cue is annotated to demonstrate its relevance, ensuring that traders can easily understand and utilize the information provided without distraction.
Conclusion
"M Farm Scalper v2" is not just an indicator but an essential trading tool for those seeking precision and efficiency in their trading operations. Its advanced features and user-friendly design make it a valuable addition to any trader’s arsenal, especially for those involved in scalping and short-term trading.
Protected script
This script is published closed-source but you may use it freely. You can favorite it to use it on a chart. You cannot view or modify its source code.
Disclaimer
The information and publications are not meant to be, and do not constitute, financial, investment, trading, or other types of advice or recommendations supplied or endorsed by TradingView. Read more in the Terms of Use.

AJ Scalp Reversal Tops and Bottoms IndicatorReuploaded after TV took it down.
A free scalping reversal, top and bottom indicator. It prints signals in real time, and should be used for scalping.
Following candle will usually always follow the signal but from there closer management is required.
This script uses RSI, Volume, OBV, Pivots and a few more indicators to calculate the signals.
Use alongside other indicators and price action analysis for best results.
Only use on time frames above 1H, otherwise the signals fire too frequently.
*These signals are different compared to other scripts created by me

Eliza Ellis Improved FractalsA little side project of mine. may enhance further in the future. Used best for scalping. The longer you're in the market the more the news is waiting to eat you so I'd recommend using high volume and getting in and out quickly

Reversal Algo (Zeiierman)█ Overview
Reversal Algo (Zeiierman) is an adaptive reversal and momentum detection system that helps identify hidden turning points, pressure zones, and changes in market direction. It brings together advanced modeling techniques such as dynamic volatility bands, adaptive trend tracking, and momentum-based confirmation signals into one clear, visual framework.
Unlike traditional reversal indicators that depend on static oscillators or fixed levels, this tool adapts in real time to market movement. It tracks volatility and directional flow to reveal when momentum is building, slowing down, or preparing to reverse.
Whether applied to short-term scalping, swing positioning, or macro structural validation, this tool provides an adaptive analytical environment that translates complex price dynamics into actionable context.
⚪ Why This One Is Unique
This version of Reversal Algo employs multi-domain adaptive modeling, combining envelope projection, trend inertia estimation, and contrarian equilibrium tracking within a single structure.
Its framework merges nonlinear smoothing manifolds with volatility-compensated directional phase mapping, allowing it to evolve with shifting market states rather than react to them.
Optional AI-driven optimizations enhance precision in unstable regimes by dynamically reshaping envelopes and tracking lines around localized flow curvature.
█ Main Features
⚪ Reversal Cloud
The Reversal Cloud highlights areas of potential expansion, compression, and turning points in price. It adapts to volatility by expanding when markets become unstable and tightening during periods of calm, creating a visual map of market rhythm and elasticity.
When the Cloud widens, it often signals exhaustion or increased turbulence; when it narrows, it suggests balance or an upcoming breakout.
With AI mode enabled, the Cloud automatically fine-tunes its shape to align with live price behavior, keeping its structure responsive and accurate.
⚪ Reversal Signals
Reversal Signals are designed to identify potential market turning points with precision. They combine multiple layers of price behavior—momentum shifts, directional changes, and balance-point deviations—to highlight areas where reversals are statistically more likely. To reduce false clusters, the system intelligently filters out repeated signals within a short time window.
⚪ Reversal/Exit Points
Reversal/Exit Points appear as small, color-coded dots above or below candles. They signal moments where price momentum slows or where the system detects a potential shift in directional strength. These markers are often found near short-term highs or lows, making them ideal for identifying profit-taking zones, re-entry setups, or early warnings of a possible reversal.
⚪ Trend Framework
The Trend Framework provides a clean visualization of the market’s prevailing direction. It smooths out short-term noise to reveal the core trend structure, showing when the market is expanding, contracting, or transitioning between phases.
This framework helps traders quickly see whether price action supports continuation or if the trend is weakening.
⚪ Trend Tracker Line
The Trend Tracker Line is a highly responsive trend detector that reacts quickly to shifts in momentum. It adapts dynamically to volatility, providing an accurate real-time view of directional acceleration and deceleration. This helps traders spot early changes in market tone and evaluate whether a move has the strength to continue.
When AI mode is enabled, the line automatically adjusts its sensitivity to remain stable and consistent across different market conditions.
⚪ Contrarian Bar Coloring
Contrarian Candle Coloring enhances chart readability by visually distinguishing strength from weakness. Green bars highlight areas of building upward momentum, while red bars point to potential pressure or exhaustion. The system continuously adapts its color transitions to reflect subtle momentum shifts, making it easier to recognize when the market is gaining or losing conviction.
An optional AI mode fine-tunes these transitions to match the current market rhythm, ensuring that candle coloration always reflects the underlying flow of strength and weakness.
█ How to Use
⚪ Reversal Trading
The primary purpose of the indicator is to identify reversal opportunities in the market. Reversal or contrarian trading means entering positions against the current directional move in anticipation of a fade or trend rotation. This approach often occurs in high-volatility environments, so it is important to widen your stops, reduce your initial position size, and, if appropriate, scale or average into positions carefully rather than committing all capital at once.
The Reversal Algo provides predefined Buy and Sell signals designed to highlight potential market peaks and troughs. While these signals are highly accurate, they are not meant to call every top or bottom perfectly. In a strong trending market, several reversal signals may appear consecutively before the market fully turns.
⚪ Reversal Signal + Candle Coloring
Combine Reversal Signals with Contrarian Candle Coloring for added confirmation. A practical approach is to wait for a Reversal Signal and then look for a color shift in the candles (for example, from contrarian-colored to standard candles). This color transition acts as confirmation that the active move may be losing strength and that a reversal could be underway.
⚪ Reversal Signals + Reversal Cloud
Consider taking reversal entries only when price interacts with the Reversal Cloud boundaries. The Cloud’s upper and lower layers act as dynamic resistance and support zones. When a Reversal Signal appears near or immediately after price rejection from one of these layers, it adds structural confirmation to the setup and strengthens the case for entry.
⚪ Reversal Signals + Key Levels
One of the most effective ways to trade Reversal Signals is by combining them with key price levels, such as the previous day’s high, low, or close. If price rejects one of these levels while a Reversal Signal prints simultaneously, the confluence of the two events serves as strong validation for a potential turning point.
⚪ Take Profit
The Reversal/Exit Points can function both as entry confirmations and as take-profit zones. If a Reversal Signal was missed but a new Reversal/Exit Point appears near a peak or trough, it can indicate a late-entry opportunity aligned with exhaustion behavior.
These dots are most powerful as profit-taking signals. Since they form near local highs and lows, they often mark regions of temporary imbalance where reversals are likely. When a Reversal/Exit Point forms in the opposite direction of your current position, consider taking partial profits or tightening stops to lock in gains while maintaining participation in the broader move.
█ How It Works
⚪ Reversal Cloud Engine
The Reversal Cloud defines the dynamic upper and lower boundaries of market elasticity by transforming recent price displacements into a smooth volatility field. Through multi-layered envelope modeling, it constructs a continuous topology of expansion and compression zones, revealing where directional energy accumulates or dissipates.
Calculation: Uses layered volatility envelopes that adapt to changing market speed and expansion. A built-in alignment mechanism keeps the upper and lower bands synchronized, while optional AI optimization adjusts the symmetry of the cloud based on short-term directional bias.
⚪ Trend Tracker System
The Trend Tracker isolates directional persistence by modeling angular displacement of price flow over adaptive temporal curvature. It interprets slope evolution as a continuously evolving directional vector field, capturing both acceleration and deceleration within the active regime.
Calculation: Applies adaptive slope modeling to estimate the dominant direction of price flow. The system smooths fluctuations dynamically while maintaining responsiveness to significant shifts in trend velocity. When AI mode is active, an intelligent weighting adjustment refines the tracker’s equilibrium bias for better phase synchronization.
⚪ Trend
The Trend module projects a dual-polarity directional lattice, distinguishing constructive (positive) and distributive (negative) flow environments. It defines equilibrium corridors that expand and contract with evolving trend geometry, offering visual feedback on regime strength and transition probability.
Calculation: Uses weighted directional regression to estimate upper, middle, and lower trend layers. Each structure is color-coded based on price slope and relative position, creating a continuous and easy-to-read trend map.
⚪ Contrarian Bar Coloring Engine
Contrarian bar coloring converts raw bar data into a slope-weighted momentum matrix, visually encoding thrust versus decay phases in real time. It acts as a microstructural interpreter of price inertia, identifying acceleration clusters and momentum fatigue through color transitions.
Calculation: Combines slope analysis and volatility normalization to evaluate how strong or weak each price bar is relative to its trend. The results are reflected in real-time color changes that emphasize momentum strength and fatigue.
⚪ Reversal/Exit System
Reversal and Exit Points are derived from an evolving volatility-based trail that tracks directional exhaustion and reversion potential. These markers visualize transitions in directional energy—helping traders anticipate trend slowdowns or reversal probabilities.
Calculation: Constructs an adaptive volatility trail that contracts as directional momentum weakens. A state-aware detection model identifies inflection points where pressure changes polarity, producing the plotted up/down dots that mark possible reversals or exits. This ensures that each signal dynamically reflects real-time shifts in market energy rather than static thresholds.
⚪ Reversal Signals Core
The Reversal System’s entry framework is designed for precision. It combines several layers of short-term momentum analysis into clear, directionally aligned signals. By balancing different market speeds and measuring how far the price moves from its equilibrium, it identifies high-probability areas where trends may continue or reverse.
Calculation: Implements a composite synchronization framework that aligns short-term momentum phases with equilibrium drift and directional bias. Redundant triggers are filtered out through temporal separation logic, ensuring only the most distinct and reliable signals are displayed. Adaptive thresholds adjust automatically based on volatility and trading mode, maintaining signal consistency across scalp, intraday, and swing environments.
⚪ AI-Adaptive Optimization Layer
The AI layer refines selected modules — Reversal Cloud, Trend Tracker, and Contrarian Candles — by continuously recalibrating their internal weighting curves according to volatility structure and price curvature. It acts as an intelligent stabilizer that adjusts smoothing depth, boundary stiffness, and gradient bias dynamically.
Calculation: Utilizes a Context-Aware Kernel Adjustment Engine, estimating curvature variance and phase imbalance to auto-tune envelope response. The model performs iterative self-alignment to preserve directional fidelity under rapidly changing flow dynamics.
-----------------
Disclaimer
The content provided in my scripts, indicators, ideas, algorithms, and systems is for educational and informational purposes only. It does not constitute financial advice, investment recommendations, or a solicitation to buy or sell any financial instruments. I will not accept liability for any loss or damage, including without limitation any loss of profit, which may arise directly or indirectly from the use of or reliance on such information.
All investments involve risk, and the past performance of a security, industry, sector, market, financial product, trading strategy, backtest, or individual's trading does not guarantee future results or returns. Investors are fully responsible for any investment decisions they make. Such decisions should be based solely on an evaluation of their financial circumstances, investment objectives, risk tolerance, and liquidity needs.
Bezahltes Script

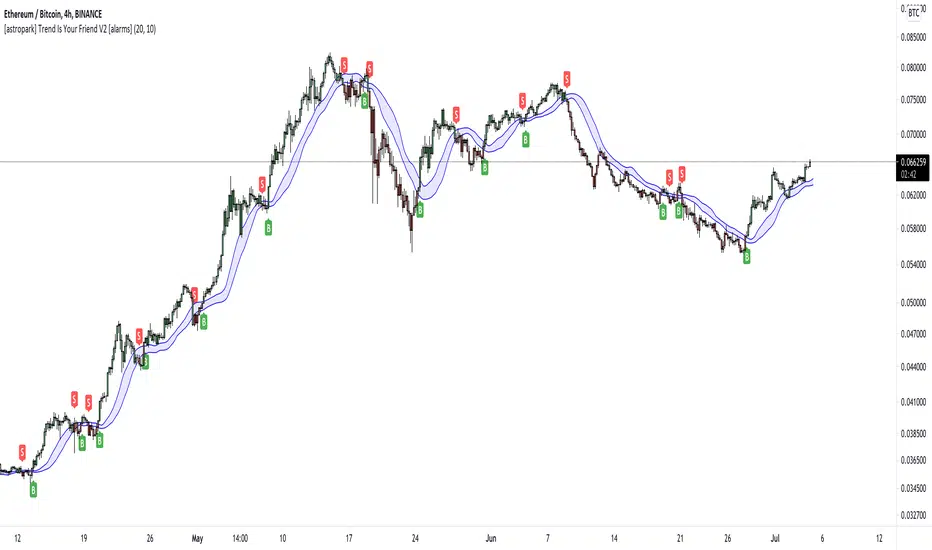
[astropark] Trend Is Your Friend V3 [alarms]Dear Followers,
today another awesome Swing and Scalping Trading Strategy indicator, runnable on a bot , which works great on High Timeframes (1D is suggested) but also on lower ones (just write me in order to help you find correct settings) and even better on 1m Renko chart!
If you are a scalper, you will love suggested entries for fast profit. You can run it on 1h timeframe (below is not suggested, there is "no-trend" below 1h!) if you are used to scalp trading and close each trade whenever you feel happy (a proper trailing stop strategy is suggested anyway).
This is not an evolution of "Trend Is Your Friend V1" or V2 , but a twin sister or the "Trend Is Your Friend V1" indicator you can see here below
and twin sister or the "Trend Is Your Friend V2" indicator you can see here below
This strategy differs for the engine used as basis, but has the same usage settings:
enable/disable signals on chart
enable/disable showing trend cloud
enable/disable bar coloring based on trend
enable/disable background coloring based on trend
edit trend period length (direct message me in order to help you fine best settings)
edit a smart variant option to enhance the trend cloud on your chart
enable/disable an option to smart enter trade
This strategy only trigger 1 buy or 1 sell. In order to get notified when a signal is triggered, you need to use the "alarms" version of this indicator.
Strategy results are calculated on the timeframe from December 2012 to now, so on 8 years, using 10000$ as initial capital and working at 1x leverage (so no leverage at all! If you like to use leverage, be sure to use a safe option, like 3x or 5x at most in order to have liquidation price very far).
This is not the "Holy Grail", so use a proper risk management strategy.
This script will let you set all notifications you may need in order to be alerted on each triggered signals.
The one for backtesting purpose can be found by searching for the astropark's "trend is your friend v3" and then choosing the indicator with "strategy" suffix in the name, or you can find here below
This is a premium indicator , so send me a private message in order to get access to this script.

[astropark] Trend Is Your Friend V3 [strategy]Dear Followers,
today another awesome Swing and Scalping Trading Strategy indicator, runnable on a bot , which works great on High Timeframes (1D is suggested) but also on lower ones (just write me in order to help you find correct settings) and even better on 1m Renko chart!
If you are a scalper, you will love suggested entries for fast profit. You can run it on 1h timeframe (below is not suggested, there is "no-trend" below 1h!) if you are used to scalp trading and close each trade whenever you feel happy (a proper trailing stop strategy is suggested anyway).
This is not an evolution of "Trend Is Your Friend V1" or V2 , but a twin sister or the "Trend Is Your Friend V1" indicator you can see here below
and twin sister or the "Trend Is Your Friend V2" indicator you can see here below
This strategy differs for the engine used as basis, but has the same usage settings:
enable/disable signals on chart
enable/disable showing trend cloud
enable/disable bar coloring based on trend
enable/disable background coloring based on trend
edit trend period length (direct message me in order to help you fine best settings)
edit a smart variant option to enhance the trend cloud on your chart
enable/disable an option to smart enter trade
This strategy only trigger 1 buy or 1 sell. In order to get notified when a signal is triggered, you need to use the "alarms" version of this indicator.
Strategy results are calculated on the timeframe from December 2012 to now, so on 8 years, using 10000$ as initial capital and working at 1x leverage (so no leverage at all! If you like to use leverage, be sure to use a safe option, like 3x or 5x at most in order to have liquidation price very far).
This is not the "Holy Grail", so use a proper risk management strategy.
This script will let you backtest how the indicator will perform on any chart you may test. Of course results will be very different depending on the chart and timeframe you will open. I tested a lot of charts and always you can find a combination that keep this strategy in profit on swing trading style (and this means that if you can have a daily look at the chart you can always manage to maximize your profit on each trade!)
The alarms version of this indicator, which will let you set all notifications you may need in order to be alerted on each triggered signals, can be found by searching for the astropark's "trend is your friend v3" and then choosing the indicator with "alarms" suffix in the name.
This is a premium indicator , so send me a private message in order to get access to this script.

[astropark] Trend Is Your Friend V2 [alarms]Dear Followers,
today another awesome Swing and Scalping Trading Strategy indicator, runnable on a bot , which works great on High Timeframes (1D is suggested) but also on lower ones (just write me in order to help you find correct settings) and even better on 1m Renko chart!
If you are a scalper, you will love suggested entries for fast profit. You can run it on 1h timeframe (below is not suggested, there is "no-trend" below 1h!) if you are used to scalp trading and close each trade whenever you feel happy (a proper trailing stop strategy is suggested anyway).
This is a twin sister or the "Trend Is Your Friend V1" indicator you can see here below
This strategy differs for the engine used as basis, but has the same usage settings:
enable/disable signals on chart
enable/disable showing trend cloud
enable/disable bar coloring based on trend
enable/disable background coloring based on trend
edit trend period length (you have to increase it if you go on lower timeframes or you go on FOREX/Stocks market, direct message me in order to help you fine best settings)
This strategy only trigger 1 buy or 1 sell. In order to get notified when a signal is triggered, you need to use the "alarms" version of this indicator.
Strategy results are calculated on the timeframe from January 2015 to now, so on 5 years, using 10000$ as initial capital and working at 1x leverage (so no leverage at all! If you like to use leverage, be sure to use a safe option, like 3x or 5x at most in order to have liquidation price very far).
This is not the "Holy Grail", so use a proper risk management strategy.
This script will let you set all notifications you may need in order to be alerted on each triggered signals.
The one for backtesting purpose can be found by searching for the astropark's "trend is your friend" and then choosing the indicator with "strategy" suffix in the name, or you can find here below
This is a premium indicator , so send me a private message in order to get access to this script.
[astropark] Trend Is Your Friend V2 [strategy]Dear Followers,
today another awesome Swing and Scalping Trading Strategy indicator, runnable on a bot , which works great on High Timeframes (1D is suggested) but also on lower ones (just write me in order to help you find correct settings) and even better on 1m Renko chart!
If you are a scalper, you will love suggested entries for fast profit. You can run it on 1h timeframe (below is not suggested, there is "no-trend" below 1h!) if you are used to scalp trading and close each trade whenever you feel happy (a proper trailing stop strategy is suggested anyway).
This is a twin sister or the "Trend Is Your Friend V1" indicator you can see here below
This strategy differs for the engine used as basis, but has the same usage settings:
enable/disable signals on chart
enable/disable showing trend cloud
enable/disable bar coloring based on trend
enable/disable background coloring based on trend
edit trend period length (you have to increase it if you go on lower timeframes or you go on FOREX/Stocks market, direct message me in order to help you fine best settings)
This strategy only trigger 1 buy or 1 sell. In order to get notified when a signal is triggered, you need to use the "alarms" version of this indicator.
Strategy results are calculated on the timeframe from January 2015 to now, so on 5 years, using 10000$ as initial capital and working at 1x leverage (so no leverage at all! If you like to use leverage, be sure to use a safe option, like 3x or 5x at most in order to have liquidation price very far).
This is not the "Holy Grail", so use a proper risk management strategy.
This script will let you backtest how the indicator will perform on any chart you may test. Of course results will be very different depending on the chart and timeframe you will open. I tested a lot of charts and always you can find a combination that keep this strategy in profit on swing trading style (and this means that if you can have a daily look at the chart you can always manage to maximize your profit on each trade!)
The alarms version of this indicator, which will let you set all notifications you may need in order to be alerted on each triggered signals, can be found by searching for the astropark's "trend is your friend v2" and then choosing the indicator with "alarms" suffix in the name.
This is a premium indicator , so send me a private message in order to get access to this script.
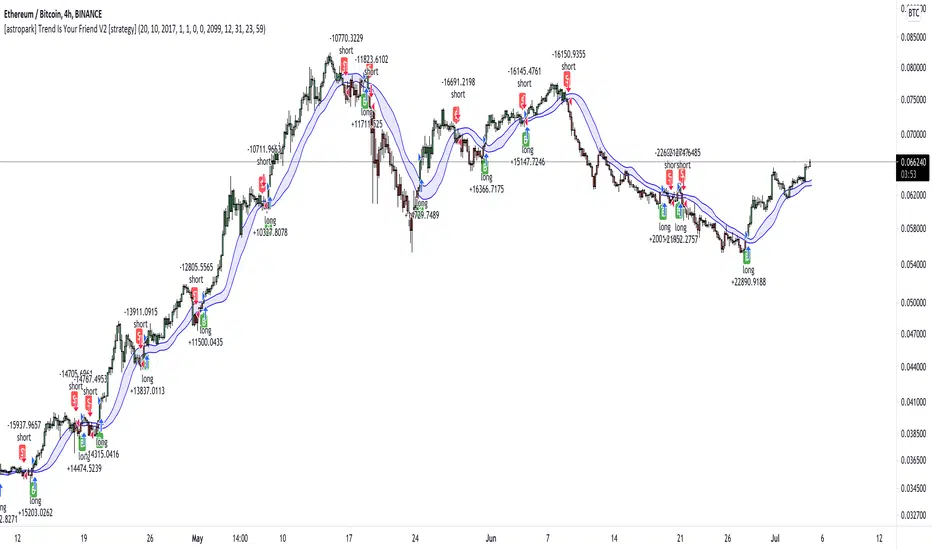
[astropark] Trend Is Your Friend V1 [alarms]Dear Followers,
today another awesome Swing and Scalping Trading Strategy indicator, runnable on a bot , which works great on High Timeframes (1D is suggested) but also on lower ones (just write me in order to help you find correct settings) and even better on 1m Renko chart!
If you are a scalper, you will love suggested entries for fast profit. You can run it on 1h timeframe (below is not suggested, there is "no-trend" below 1h!) if you are used to scalp trading and close each trade whenever you feel happy (a proper trailing stop strategy is suggested anyway).
This strategy let's you edit following settings:
enable/disable signals on chart
enable/disable showing trend cloud
enable/disable bar coloring based on trend
enable/disable background coloring based on trend
enable a special option to enhance trend cloud on FOREX/Stocks charts (optional)
edit trend period length (you have to increase it if you go on lower timeframes, like 1h)
This strategy only trigger 1 buy or 1 sell. In order to get notified when a signal is triggered, you need to use the "alarms" version of this indicator.
Strategy results are calculated on the timeframe from August 2017 to now, so on almost 2 years and half, using 10000$ as initial capital and working at 1x leverage (so no leverage at all! If you like to use leverage, be sure to use a safe option, like 3x or 5x at most in order to have liquidation price very far).
This is not the "Holy Grail", so use a proper risk management strategy.
This script will let you set all notifications you may need in order to be alerted on each triggered signals.
The one for backtesting purpose can be found by searching for the astropark's "trend is your friend" and then choosing the indicator with "strategy" suffix in the name, or you can find here below
This is a premium indicator , so send me a private message in order to get access to this script.

[astropark] Trend Is Your Friend V1 [strategy]Dear Followers,
today another awesome Swing and Scalping Trading Strategy indicator, runnable on a bot , which works great on High Timeframes (1D is suggested) but also on lower ones (just write me in order to help you find correct settings) and even better on 1m Renko chart!
If you are a scalper, you will love suggested entries for fast profit. You can run it on 1h timeframe (below is not suggested, there is "no-trend" below 1h!) if you are used to scalp trading and close each trade whenever you feel happy (a proper trailing stop strategy is suggested anyway).
This strategy let's you edit following settings:
enable/disable signals on chart
enable/disable showing trend cloud
enable/disable bar coloring based on trend
enable/disable background coloring based on trend
enable a special option to enhance trend cloud on FOREX/Stocks charts (optional)
edit trend period length (you have to increase it if you go on lower timeframes, like 1h)
This strategy only trigger 1 buy or 1 sell. In order to get notified when a signal is triggered, you need to use the "alarms" version of this indicator.
Strategy results are calculated on the timeframe from August 2017 to now, so on almost 2 years and half, using 10000$ as initial capital and working at 1x leverage (so no leverage at all! If you like to use leverage, be sure to use a safe option, like 3x or 5x at most in order to have liquidation price very far).
This is not the "Holy Grail", so use a proper risk management strategy.
This script will let you backtest how the indicator will perform on any chart you may test. Of course results will be very different depending on the chart and timeframe you will open. I tested a lot of charts and always you can find a combination that keep this strategy in profit on swing trading style (and this means that if you can have a daily look at the chart you can always manage to maximize your profit on each trade!)
The alarms version of this indicator, which will let you set all notifications you may need in order to be alerted on each triggered signals, can be found by searching for the astropark's "trend is your friend" and then choosing the indicator with "alarms" suffix in the name.
This is a premium indicator , so send me a private message in order to get access to this script.

Urban TowersI translated a scalping system by Navin Prithyani into pine and want to share it with you.
Navin has a lot of resources for the system online including an extensive +60m video explaining the ins and outs.
Including links is against the house rules, so you'll have to DYOR.
Quick Criteria Overview:
---
- Can see through EMAs
- Entry above the signal candle
- Stop below the signal candle
- Targets include 1:1, trailing stop, and psychological levels
Why not give it a whirl? Back test it and share your results.
This is a fairly mechanical scalping system to be used on lower time frames.
I have programmed alerts into the system so you don't have to stare at your screen all day.
Happy profits y'all, enjoy the scalper.
Peace.

Trend Hunter [forex and binary]This is an amazing script for scalp trading.
It is basically self-explanatory. Just search, add to chart and start using as per the arrows.
Feel free to comment and ask anything
You can also use the binary options methods
DO NOT
dont enable forex together with direction. Only one of them should be turned on
Best Practice
enable one option at a time on the list
forex
binary
direction

Series of Heikin ashi candle strategySeries of Heikin ashi candle strategy, idea and rules:
After 2 consecutive heikin ashi candles of same color, place a buy stop order at high of last candle if green or a sell stop order at low of last candle if red.
Strategy follows the open order with trailing stop.
Use on charts with heikin ashi candles.
Good on lower timeframes and scalping.
Please use comment section for any feedback.
Next improvment (only to who is interested to this script and follows me): study with alerts. Leave a comment if you want to have access to study.
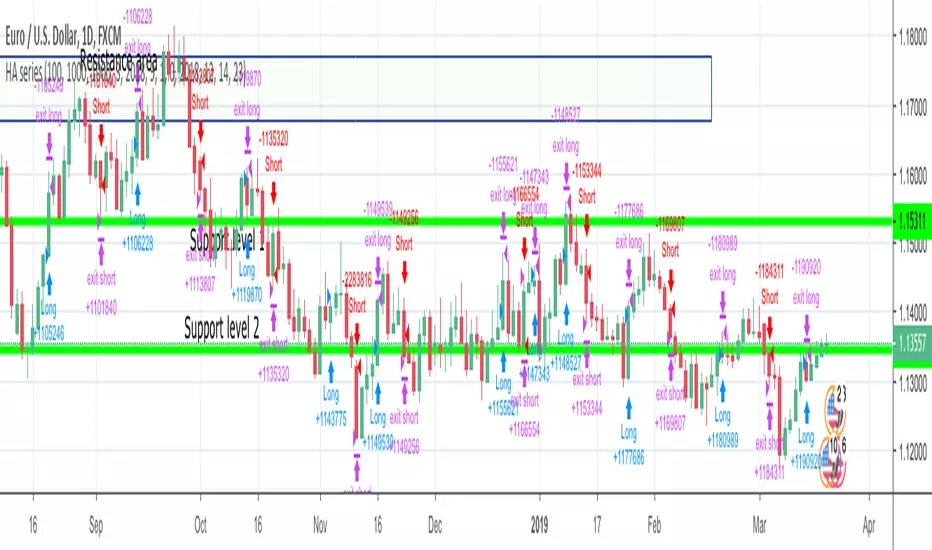
BitcoinSpeak Scalper - Buy / Sell v2.0This is an indicator for scalpers, ideal for playing scalping, it is recommended to use it on TF 5m, and when doing SELL / BUY execution try dilakakukan after candle closed, to avoid fake signal because timeframe low.
latest update 24 april 2018
for Donation :
BTC : 1NAakftCQjKy64bhvM5zctZpLJm2esJaX
XLM : GC4KAS6W2YCGJGLP633A6F6AKTCV4WSLMTMIQRSEQE5QRRVKSX7THV6S TAG/Memo : 400505
ADA : DdzFFzCqrhstM1gzRZvE5ZN3s4Px6GgkeMjrMsz7muDLEAzPpML8DzdPuCZnTUdPRwjuuJccrK5eGpU4muaAeBgMP7sLo5Hr4nmSe4MV

JAM ALGO Signals
"Remove the filters to view signals, then customize the parameters to your preference and enjoy using the indicator!" ✅
JAM ALGO Signals
Description:
🚀 Advanced Trading Signals with Risk Management & Alerts
This indicator is a complete all-in-one tool for traders seeking precise entries and exits with built-in risk management and real-time statistics. It combines RSI and EMA-based analysis, projected Take Profit (TP) and Stop Loss (SL) levels, customizable filters, and premium alerts directly on your TradingView chart.
✨ Key Features:
Entry Signals 🔹
Buy & Sell signals based on price action and RSI conditions.
Trend confirmation via EMA (200 and optional 50-period filters).
Visual signals: Labels, Arrows, Triangles, or Text.
Risk Management (RR) ⚖️
Define Stop Loss (SL) and multiple Take Profit levels (TP1, TP2, TP3) based on risk ratio (R).
Configurable projection bars to visualize target levels.
Colored zones for TP & SL, with optional borders for clarity.
Premium Alerts 🔔
Alerts for BUY / SELL signals, TP1 / TP2 / TP3, and SL hits.
Instant notifications when levels are reached.
Advanced Filters 🛡️
EMA50 Trend Filter: confirms short-term trend.
RSI Direction Filter: ensures momentum alignment.
Volatility Filter (ATR14 > Range): ensures enough market movement.
Candle Size Filter: avoids entries on too small candles.
SL Overlap Filter: prevents trades overlapping existing SL levels.
Real-Time Statistics 📊
Total trades, wins (TP1), and losses (SL).
Winrate (%), cumulative profit, and average RR ratio.
Optimizes strategy tracking directly on the chart.
Customizable Visuals 🎨
TP & SL line colors and styles (solid, dashed, dotted).
Fully adjustable signal labels (color, size, type).
Configurable stats table with background & text colors.
🔥 Advantages:
Complete tool for day trading and swing trading.
Clear visualization of critical risk/reward levels.
Automatic alerts for fast reaction without constant monitoring.
Integrated statistics for performance evaluation and strategy improvement.
Recommended for:
Traders using price action, intraday strategies, scalping, or swing trading, who want advanced risk management with visual signals and performance analytics on TradingView.

Options Scalper v2 - SPY/QQQHere's a comprehensive description of the Options Scalper v2 strategy:
---
## Options Scalper v2 - SPY/QQQ
### Overview
A multi-indicator confluence-based scalping strategy designed for trading SPY and QQQ options on short timeframes (1-5 minute charts). The strategy uses a scoring system to generate high-probability CALL and PUT signals by requiring alignment across multiple technical indicators before triggering entries.
---
### Core Logic
The strategy operates on a **scoring system (0-9 points)** where both bullish (CALL) and bearish (PUT) conditions are evaluated independently. A signal only fires when:
1. A recent EMA crossover occurred (within the last 3 bars)
2. The direction's score meets the minimum threshold (default: 4 points)
3. The signal's score is higher than the opposite direction
4. Enough bars have passed since the last signal (cooldown period)
5. Price action occurs during valid trading sessions
---
### Indicators Used
| Indicator | Purpose | CALL Condition | PUT Condition |
|-----------|---------|----------------|---------------|
| **9/21 EMA Cross** | Primary trigger | Fast EMA crosses above slow | Fast EMA crosses below slow |
| **200 EMA** | Trend filter | Price above 200 EMA | Price below 200 EMA |
| **RSI (14)** | Momentum filter | RSI between 45-65 | RSI between 35-55 |
| **VWAP** | Institutional level | Price above VWAP | Price below VWAP |
| **MACD (12,26,9)** | Momentum confirmation | MACD line > Signal line | MACD line < Signal line |
| **Stochastic (14,3)** | Overbought/Oversold | Oversold or K > D | Overbought or K < D |
| **Volume** | Participation confirmation | Spike on green candle | Spike on red candle |
| **Price Structure** | Breakout detection | Higher high formed | Lower low formed |
---
### Scoring Breakdown
**CALL Score (Max 9 points):**
- Recent EMA cross up: +2 pts
- EMA alignment (fast > slow): +1 pt
- RSI in bullish range: +1 pt
- Above VWAP: +1 pt
- MACD bullish: +1 pt
- Volume spike on green candle: +1 pt
- Stochastic setup: +1 pt
- Above 200 EMA: +1 pt
- Breaking higher high: +1 pt
**PUT Score (Max 9 points):**
- Recent EMA cross down: +2 pts
- EMA alignment (fast < slow): +1 pt
- RSI in bearish range: +1 pt
- Below VWAP: +1 pt
- MACD bearish: +1 pt
- Volume spike on red candle: +1 pt
- Stochastic setup: +1 pt
- Below 200 EMA: +1 pt
- Breaking lower low: +1 pt
---
### Risk Management
The strategy uses **ATR-based dynamic stops and targets**:
| Parameter | Default | Description |
|-----------|---------|-------------|
| Stop Loss | 1.5x ATR | Distance below entry for longs, above for shorts |
| Take Profit | 2.0x ATR | Creates a 1:1.33 risk-reward ratio |
Positions are also closed on:
- Opposite direction signal (flip trade)
- Take profit or stop loss hit
---
### Session Filtering
Trades are restricted to high-liquidity periods by default:
- **Morning Session:** 9:30 AM - 11:00 AM EST
- **Afternoon Session:** 2:30 PM - 3:55 PM EST
This avoids choppy midday price action and captures the highest volume periods.
---
### Input Parameters
| Parameter | Default | Description |
|-----------|---------|-------------|
| Fast EMA | 9 | Fast moving average period |
| Slow EMA | 21 | Slow moving average period |
| Trend EMA | 200 | Long-term trend filter |
| RSI Length | 14 | RSI calculation period |
| RSI Overbought | 65 | Upper RSI threshold |
| RSI Oversold | 35 | Lower RSI threshold |
| Volume Multiplier | 1.2x | Volume spike detection threshold |
| Min Signal Strength | 4 | Minimum score required to trigger |
| Crossover Lookback | 3 | Bars to consider crossover "recent" |
| Min Bars Between Signals | 5 | Cooldown period between signals |
---
### Visual Elements
**Chart Plots:**
- Green line: 9 EMA (fast)
- Red line: 21 EMA (slow)
- Gray line: 200 EMA (trend)
- Purple dots: VWAP
**Signal Markers:**
- Green triangle up + "CALL" label: Buy call signal
- Red triangle down + "PUT" label: Buy put signal
- Small circles: EMA crossover reference points
**Info Table (Top Right):**
- Real-time CALL and PUT scores
- RSI, MACD, Stochastic values
- VWAP and 200 EMA position
- Recent crossover status
- Current signal state
---
### Alerts
| Alert Name | Trigger |
|------------|---------|
| CALL Entry | Standard call signal fires |
| PUT Entry | Standard put signal fires |
| Strong CALL | Call signal with score ≥ 6 |
| Strong PUT | Put signal with score ≥ 6 |
---
### Recommended Usage
| Setting | 0DTE Scalping | Intraday Swings |
|---------|---------------|-----------------|
| Timeframe | 1-2 min | 5 min |
| Min Signal Strength | 5-6 | 4 |
| ATR Stop Mult | 1.0 | 1.5 |
| ATR TP Mult | 1.5 | 2.0 |
| Option Delta | 0.40-0.50 | 0.30-0.40 |
---
### Key Improvements Over v1
1. **Requires actual crossover** - Eliminates false signals from simple trend continuation
2. **Balanced scoring** - Both directions evaluated equally, highest score wins
3. **Signal cooldown** - Prevents overtrading with minimum bar spacing
4. **Multi-indicator confluence** - 8 factors must align for signal generation
5. **Volume-candle alignment** - Volume spikes only count when matching candle direction
---
### Disclaimer
This strategy is for educational purposes. Backtest thoroughly before live trading. Options trading involves significant risk of loss. Past performance does not guarantee future results.

Supertrend Scalper v1.0 (빌립's Trading)Supertrend Scalper V1.0 – 초대전용 스캘핑 인디케이터
이 스크립트는 Supertrend 추세를 기반으로, 지지/저항 되돌림 구간에서 단기 스캘핑 진입 타이밍만 직관적으로 보여주는 초대전용 인디케이터입니다.
Supertrend 방향이 유지되는 구간에서, 슈퍼트렌드 라인 근처 되돌림 발생 시에만 BUY / SELL 진입 신호를 생성합니다.
신호는 봉 마감(종가 확정) 기준으로만 확정되며, 과도한 실시간 깜빡임을 최소화했습니다.
한 번 진입 신호가 발생하면 해당 포지션의 TP / SL 가격이 터치될 때까지 추가 신호가 나오지 않으며, 항상 한 포지션만 운영하는 구조로 설계되어 있습니다.
진입 라벨 색상:
최초 BUY 진입: 초록색
최초 SELL 진입: 빨간색
TP 도달: 핑크색
SL 도달: 파란색
→ 색깔만 봐도 진입/청산 결과를 한눈에 확인할 수 있습니다.
기본적으로 3분 / 5분 / 15분 등의 단기 타임프레임에서 크립토 선물 스캘핑을 염두에 두고 설계되었지만, 시장/종목/타임프레임에 따라 사용자가 직접 테스트 후 활용하시길 권장합니다.
⚠ 면책사항
이 인디케이터는 교육 및 연구용 참고 도구일 뿐, 특정 매수/매도/투자를 직접적으로 권유하는 것이 아닙니다.
모든 매매 결정과 그에 따른 손익은 전적으로 사용자 본인의 책임입니다. 실제 사용 전 반드시 충분한 백테스트와 모의투자를 통해 전략 적합성을 검증하시기 바랍니다.
Supertrend Scalper is a short-term trend-following scalping indicator built on the Supertrend concept.
The script looks for pullbacks to the Supertrend line in the direction of the prevailing trend and prints clear BUY / SELL labels only after the bar is closed (close-confirmed signals to reduce repaint-like noise).
Once a signal appears and a position is considered open, the script tracks a fixed TP (%) and SL (%) from the entry price:
- Initial BUY label = green
- Initial SELL label = red
- When TP is hit, the label changes to pink
- When SL is hit, the label changes to blue
Only one position is active at a time. No new signals are generated until either TP or SL is reached, which helps to avoid over-trading in choppy zones.
Default settings are optimized for lower timeframes (e.g. 3m/5m/15m crypto futures scalping), but users should adjust parameters and backtest according to their own market, symbol and risk profile. This script is for educational and informational purposes only and is not financial advice.

MTF Scalper - alemicihanMulti-Timeframe Scalper Strategy: Aligning the Big Picture for Quick Gains
This article presents a robust futures trading strategy designed for high-frequency scalping in the crypto market. It’s built on the principle of minimizing risk by ensuring that short-term entries are always aligned with the dominant, higher-timeframe trend.
The Core Concept: Alignment is Key
A Balanced Trend Follower approach, now refined for rapid scalping, uses a Multi-Timeframe (MTF) confirmation system to filter out market noise and increase the probability of a successful trade.
The strategy operates on a Low Timeframe (LTF) chart (e.g., 3m, 5m, or 15m) but only executes trades if the direction is validated by three Higher Timeframes (HTF).
ComponentPurposeFunctionHTF (D, 4h, 1h) EMA => Trend Confirmation =>Checks if the current price is above/below all three Exponential Moving Averages (EMA 20). This provides a strong directional bias.
LTF (5m) Stochastic RSI => Momentum Entry => Generates the actual buy/sell signal by spotting a swift crossover, indicating fresh momentum in the direction of the confirmed HTF trend.
How The Signal Is Generated
Trend Alignment: The system first confirms the trend. If the price is trading above the Daily, 4-Hour, and 1-Hour EMAs, the market is deemed to be in a Strong LONG Trend. Only LONG signals are permitted.
Momentum Trigger: Once the trend is confirmed, a Long Signal is generated only when the Stochastic K-Line crosses above the D-Line, indicating a momentum shift (a pullback ending) towards the main trend direction.
Short Signal: The inverse logic applies to the Short Trend confirmation and entry signal.
Mandatory Risk Management: ATR-Based Exit
Given the high leverage nature of futures and scalping, static Stop-Loss (SL) and Take-Profit (TP) levels are inefficient. This strategy uses the Average True Range (ATR) indicator to dynamically set profit and loss targets based on current market volatility.
Stop Loss (SL): Set dynamically at 1.5 x ATR below (for long) or above (for short) the entry price. This gives the trade enough room to breathe without risking excessive capital.
Take Profit (TP): Set dynamically at 3.0 x ATR, establishing a robust Risk-to-Reward Ratio of 1:2.
Final Thoughts on Testing
This sophisticated approach combines the reliability of MTF analysis with the speed of momentum indicators. However, data analysis is key. Backtesting these parameters (EMA, ATR Multipliers, RSI/Stochastic lengths) on your chosen asset (like BTC/USDT or ETH/USDT) and timeframe is crucial to achieving optimal performance.

Advanced Triple Strategy ScalperHere are the three scalping strategies presented in the video "3 Scalping Strategies That Work Every Day (Backtested & Proven)" by Asia Forex Mentor – Ezekiel Chew:
### Scalper’s Trend Filter (Triple EMA)
This strategy uses three EMAs (25, 50, 100) on the 5-minute chart to filter high-probability trades aligned with momentum .
- Only trade when all three EMAs are angled in the same direction and clearly separated (no crossing or tangling) .
- Enter when price pulls back toward the 25 or 50 EMA and then bounces back toward the 25 EMA, but do not enter if price closes below the 100 EMA .
- Set stop-loss just below the 50 EMA or swing low and aim for a risk-to-reward ratio of 1:1.5 .
### Flip Zone Trap (Reversal Catching)
This method identifies precise reversal moments where market structure shifts from weakness to strength .
- Use the 15-min chart to locate key support or resistance zones where price previously reacted .
- Wait for price to stop making lower lows and begin making higher highs (or vice versa for shorts); confirm with a trendline break AND follow-through (higher lows & highs within 5-7 candles) .
- Use confirmation candles (bullish engulfing, pin bar rejection) at the zone before entry .
### Liquidity Shift Trigger (Smart Money Trap)
This system leverages institutional stop hunts and liquidity sweeps at key zones for sniper entries .
- Start with a 15-min chart to identify structure breaks and points of interest (order blocks, flip zones, demand zones) .
- Drop to 1-min chart and wait for price to enter the refined zone and sweep liquidity (sharp wick/spike below/above key level) .
- Once liquidity is swept, wait for a clean structure shift (break of most recent internal high or low) within 5–6 candles—if confirmed, refine entry to the candle that caused the break and enter when price returns to that candle with a strong reaction .
***
### Practical Application
- These strategies are systematic, rule-based, and designed to cut out fake moves, avoid early stop-outs, and align entries with momentum and institutional activity .
- Perfect for short timeframes and volatile pairs like XAUUSD, especially if paired with additional confirmation from other technical analysis tools .
All three strategies emphasize filtering noise, waiting for momentum/trend confirmation, and avoiding impulsive entries—key principles for consistent scalping success
