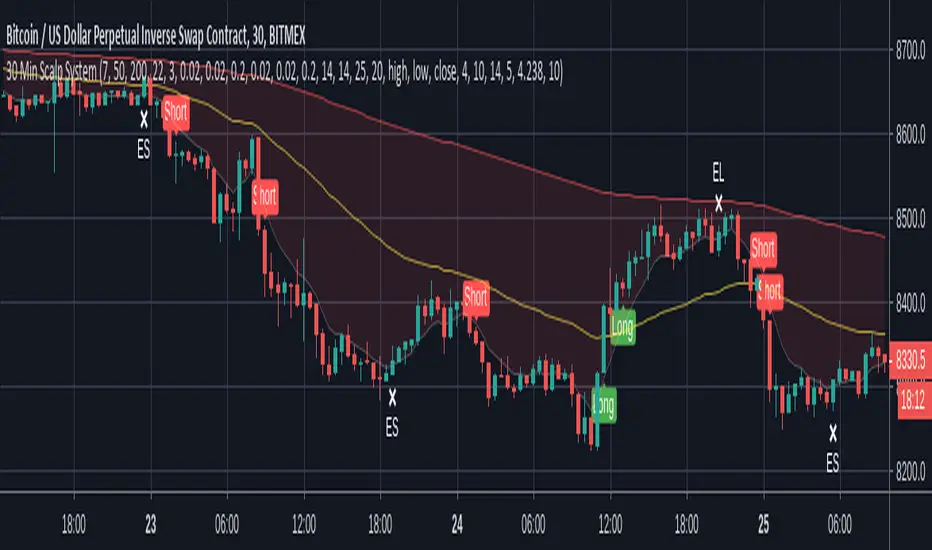
30 Min Scalp SystemA scalping script for the 30 min chart that is designed and tuned to be used with trading bots such as ProfitView or Autoview. I personally trade with this on Bitmex.
This trading system is built upon 4 established trading indicators that compliment each other. All signals are filtered in a number of ways to avoid chop and only trigger when a strong trend or crossover is identified.
Alerts are included for longs, shorts and exits in both directions.
Recommended setup:
- Trade with leverage and take 75%-80% out at 0.5% profit, leaving the rest to run
- Initial stop-loss of 1%, initiating a trailing stop of 0.75% when TP is hit
- Ensure bots are set to ignore open orders in the same direction
I use this in conjunction with ProfitView where I run three custom scripts to manage my position entries, monitor profit levels, dynamically move my stop and then exit positions where appropriate.
Note: Exit signals are show here even when trades aren't open because it's only possible to hide these when using a strategy script. This is coded as an indicator so that alerts can be sent to your chosen bot.
Disclaimer: The signals aren't perfect but no script is. The above cannot be considered financial advice and I take no responsibility from any losses incurred. A test account is recommended to verify the win rate before trading on a live platform.
In den Scripts nach "scalp" suchen
Chidams Indicator Beta 1Normal mode is good for trend reversals
While scalp mode is oriented for intraday traders
Please note that it is safer to wait for candle closure

EMA cross scalp strategy 1m 5m nas100meant for scalping on NAS100 on the 5m and 1m time frames (testing version

Triangular Moving Average (TMA) bandsWhat in the world is up folks ??!??
Here's the indicator of the day. Sharing a simple one today because I'm busy coding for a few clients (fun life of a top script author on TradingView)
The TMA bands is an indicator that I discovered on FXCM a few years ago FXCM TMA bands
From the screenshot above, we see that when the price hits the lower band, it's a possible reverse BUY signal. When it hits the upper band, it's a possible SELL signal
Methodology
1) The Take Profit 1 is the middle line, Take Profit 2 is the opposite band.
2) Once the TP1 is hit, set your Stop Loss to breakeven
3) Once the TP2 is hit, if you still want to stay in the trade, set your Stop Loss to the TP1
That's what we call a trailing stop loss which I offered in the Trade Manager : Trade-Manager-Open-Source-Version/
It will be a powerful tool in your arsenal for some scalp/intraday trades
After years of coding for traders, I worked with many brokers/API/languages so I'm very used to convert a script from a broker to another one (shameless self-advertising)
PS
Tomorrow I'll share the Signal version of my Algorithm Builder:
You'll be able to connect it in a single click to a very cool Backtest System made by the Pinescripters community
In other words, I'm selling the scripts to allow you to build your own signals in a few clicks AND to connect it easily to a kick-ass backtesting tool. More to come tomorrow
Hope you'll like it, like me, love it, love me, tip me :)
____________________________________________________________
Feel free to hit the thumbs up as it shows me that I'm not doing this for nothing and will motivate to deliver more quality content in the future. (Meaning... a few likes only = no indicators = Dave enjoying the beach)
- I'm an officially approved PineEditor/LUA/MT4 approved mentor on codementor. You can request a coaching with me if you want and I'll teach you how to build kick-ass indicators and strategies
Jump on a 1 to 1 coaching with me
- You can also hire for a custom dev of your indicator/strategy/bot/chrome extension/python

APEX - Swing Aura StrategyA backtester of my new strat, it's a hybrid swing/scalp strat that really looks for quick low profits. Will keep it hidden as it's a bit of a work in progress right now. Working on it to perform well enough with the Apex Trading bot, ran it for a day now and it ended the day on a 1.78% portfolio profit, so I'm really pleased with that.
As for details it's based on Keltner Channels, Bolingers Bands and a Ichimoku cloud. To spice it up there's even a Wave trend in there as well!
All the settings for the bits and parts are changeable so feel free to mess around with them, but will keep my sell triggers fixed for now, so no editing of those from within the script unfortunately.
Enjoy!

PerPro Crypto ScalperPerPro Crypto Scalper es un algoritmo que funciona con 4 robot internos que trabajan sincronisadamente para enviar una senal de trading.
Según el crypto que se desee tradear es la configuración que le debemos colocar en trailing stop y take profit.
PerPro Crypto Scalper (CS) is an algorithm system with
with 4 internal robots that work synchronously to send you a trading signal.
Depending on the type of crypto you want to trade, it is the setting that must be configured. that I sent it by private message

ezy scalp Mr.HokageJadi di indikator ini memiliki 3 garis Yang memiliki beberapa fungsi
Garis merah Menjadi support mid term atau trend mid term Jadi Jika garis Merah tetap di warna merah berarti Harga akan koreksi atau masih koreksi dan Jika berubah menjadi Hijau maka Harga Bullish untuk mid term tergantung timeframe yg kalian pakai dan Jika garis ini di tembus harga itu bisa menjadi pertanda reversal atau perubahan arah
Lalu ada garis Kuning dan Putih itu bisa menjadi resistance atau support sementara
bagaimana Trading menggunakan indikator ini?
untuk scalping kalian bisa menggunakan Garis Kuning dan putih eksekusinya mengikuti garis tersebut misalkan Garis Putih berubah menjadi Hijau maka lakukan Buy dan targetnya adalah garis Kuning Begitu juga jika garis kuning berubah Menjadi hijau maka lakukan Buy targetnya adalah garis merah dan misalkan 3 garis tersebut sama sama Hijau berarti Bullish yang kuat dan Jika garis tiba tiba dari hijau berubah menjadi warna lain ntah itu kuning merah atau putih berarti harga akan turun/koreksi
Kuncinya ada di garis merah Jika harga menembus garis ini ntah itu dari bawah ke atas itu berarti bullish dan jika dari atas ke bawah itu artinya bearish dan cukup berdampak Besar

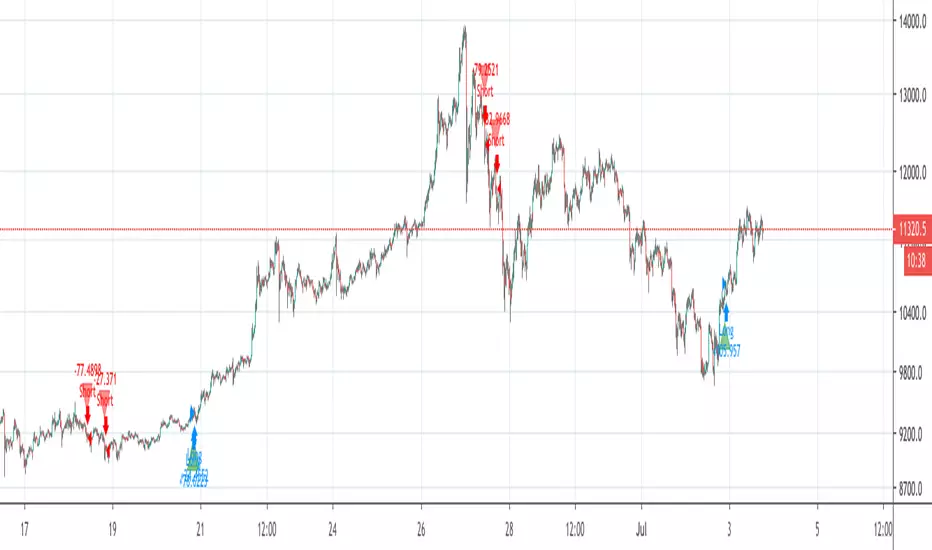
PPSignal BB-EWO BB $ CFB Strategy ScalpThis indicator is an implementation of the Bollinger Band, CFB and EWO Oscillator Scalping system.
This technique is for those who want the most simple method that is very effective. It is BEST traded during the busiest trading hours, 3am to 12am EST NY time. This method doesn't work in sideways markets, only in volatile trending markets.
-Time Frames: 1, 5, 10, 15 ,30 min.
-Currency pairs: majors, btc , futures and volatile stock.
Other Chart indicators:
Add EWO bb.
Optionally Add Squeeze Indicato or bbsqueeze .
Here's the strategy:
// Going LONG:
Enter a long position when CFB has crossed up through the Bollinger upper band (lime) . At the same time, the EWO BB or BBqueeze should be approaching or crossing it's zeroline, going up. This is indicated by "Buy" alert.
// Going SHORT:
Enter a short position when CFB has crossed down through the low Bollinger red. At the same time, the EWO BB or BBqueeze should be approaching or crossing it's zero line, going down. This is indicated by the "Sell" Alert.
// Take profit:
// 10-20 pips depending on pair or When Awesome Oscillator turns a different color.
// HINTS: Best trades tend to occur when price reversing bounce off outer band and and outside Optional Bollinger Squeeze indication.
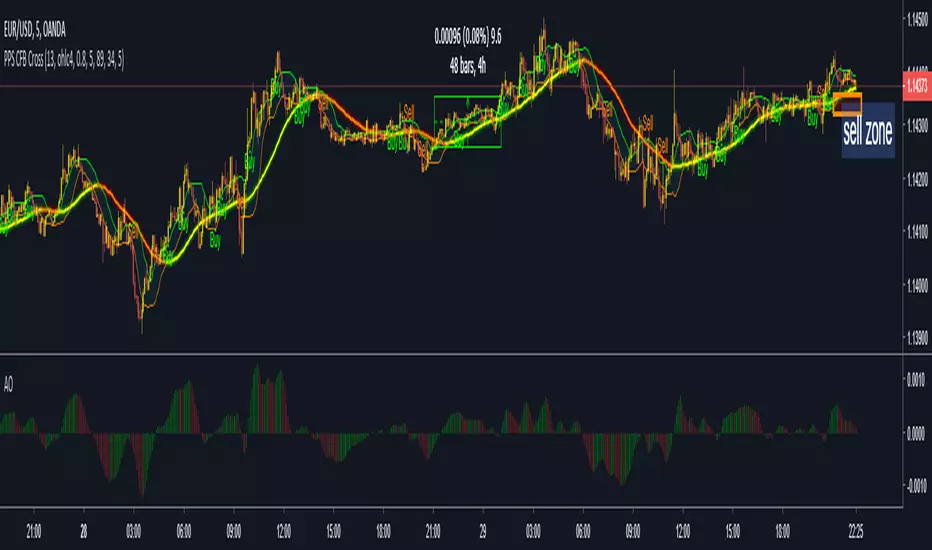
PPSignal BB-EWO BB $ CFB Strategy ScalpThis indicator is an implementation of the Bollinger Band and EWO Oscillator and CFB Scalping system.
This technique is for those who want the most simple method that is very effective. It is BEST traded during the busiest trading hours, 3am to 12am EST NY time. This method doesn't work in sideways markets, only in volatile trending markets.
-Time Frames: 1, 5, 10, 15 ,30 min.
-Currency pairs: majors, btc , futures and volatile stock.
Other Chart indicators:
Add EWO bb.
Optionally Add Squeeze Indicato or bbsqueeze .
Here's the strategy:
// Going LONG:
Enter a long position when CFB has crossed up through the Bollinger upper band (lime) . At the same time, the EWO BB or BBqueeze should be approaching or crossing it's zeroline, going up. This is indicated by "Buy" alert.
// Going SHORT:
Enter a short position when CFB has crossed down through the low Bollinger red. At the same time, the EWO BB or BBqueeze should be approaching or crossing it's zero line, going down. This is indicated by the "Sell" Alert.
// Take profit:
// 10-20 pips depending on pair or When Awesome Oscillator turns a different color.
// HINTS: Best trades tend to occur when price reversing bounce off outer band and and outside Optional Bollinger Squeeze indication.
// References:
https://www.forexstrategiesresources.com...

TUX EMA Scalper+SuperTrendI sum up scripts TUX Ema Scalper by tux and Supertrend by abhi.shri2702
This script is just created for backtesting xbtusd.
Buy / Sell signal : Tux Ema Scalper mechanism ( ema 20 : up /down)
Green Arrow : Long
Pink Arrow : Short
Thank you for creators.

Smooth ScalpHello Fellow Traders!
-------------------------------------------
This is the newest addition to Gnome Alerts PRO!
This is for scalping short and long term trends on BITMEX & Deribit!
INCLUDES:
------------------------
*Autoview Ready*
BUY ALERTS
- supports pyramiding
- sell based of %gain
SELL ALERTS
- supports pyramiding
- sell based of %gain
- stop loss configured
- sell on gain configured
Backtesting is also available!
More info on how gain access in my profile!

Smooth Scalp BacktestHello Fellow Traders!
-------------------------------------------
This is the newest addition to Gnome Alerts PRO!
This is for scalping short and long term trends on BITMEX & Deribit!
INCLUDES:
------------------------
*Autoview Ready*
BUY ALERTS
- supports pyramiding
- sell based of %gain
SELL ALERTS
- supports pyramiding
- sell based of %gain
- stop loss configured
- sell on gain configured
Backtesting is also available!
More info on how gain access in my profile!


TTM scalper indicator Backtest TTM scalper indicator of John Carter’s Scalper Buys and Sells. The methodology
is a close approximation of the one described in his book Mastering the Trade.
The book is highly recommended. Note the squares are not real-time but will
show up once the third bar has confirmed a reversal.
You can change long to short in the Input Settings
WARNING:
- For purpose educate only
- This script to change bars colors.

Crypto Scalping Strategy by SAIFOverview
An optimized scalping strategy designed for cryptocurrency markets, focusing on breakout opportunities with strict risk controls and optional safe compounding features. This strategy combines price action, volume analysis, and multi-timeframe trend confirmation.
Key Features
Breakout Detection System
Identifies significant price breakouts using dynamic channel analysis
Confirms breakouts with volume surge validation
Filters trades based on multi-timeframe trend alignment
Multi-Timeframe Trend Confirmation
Analyzes 1-hour and 4-hour timeframes for trend direction
Only takes trades aligned with higher timeframe trends
Uses long-term moving averages for trend validation
Advanced Risk Management
Conservative default risk: 1% per trade
ATR-based stop-loss placement (2x ATR)
Trailing stop mechanism to protect profits
Minimum profit target before trailing activates
Built-in position sizing based on account equity
Safe Capital Management Options
Fixed Capital Mode: Trade with consistent position sizes
Safe Compounding Mode: Gradually scales position size based on realized profits only
Drawdown Protection: 80% equity floor prevents excessive capital erosion
Leverage Control: 10x leverage factored into position calculations
Technical Filters
Momentum confirmation via oscillator conditions
Directional movement analysis
Volume threshold requirements
Trend strength validation
Position Sizing
The strategy automatically calculates position sizes based on:
Your specified risk percentage
Current ATR volatility
Available leverage
Account equity (with optional compounding)
Trade Management
Entry: Executes on confirmed breakouts with volume and trend alignment
Stop Loss: Placed at 2x ATR from entry
Take Profit: Uses trailing stops that activate after minimum profit threshold
Exit: Automatically managed through strategy exits
Customization Options
Adjustable channel length for breakout detection
Configurable volume multiplier for surge detection
Customizable oscillator thresholds
Flexible ATR period for volatility measurement
Optional compounding vs. fixed capital modes
Adjustable trailing stop parameters
Visual Features
Channel boundaries plotted on chart
Entry signals marked with arrows
Background coloring indicates trend direction
Real-time info table shows:
Current risk level
Compounding status
Capital values
Drawdown protection status
Alert Capabilities
Built-in alert conditions for:
Buy signals (breakout opportunities)
Sell signals (breakdown opportunities)
Important Disclaimers
⚠️ Educational Purpose Only: This strategy is provided for educational and research purposes. It is not investment advice.
⚠️ High-Risk Trading: Scalping and leverage trading carry substantial risk of loss. Cryptocurrency markets are highly volatile.
⚠️ Not Financial Advice: This tool does not constitute financial, investment, or trading advice. Always conduct your own research and consult qualified professionals.
⚠️ Leverage Warning: This strategy uses 10x leverage, which can amplify both gains and losses significantly.
⚠️ Backtesting Limitations: Past performance does not guarantee future results. Real trading involves slippage, execution delays, and emotional factors not present in backtesting.
⚠️ Capital at Risk: Only trade with capital you can afford to lose completely. Never trade with borrowed money or funds needed for living expenses.
Commission & Fees
Commission: 0.13% per trade
Initial capital: $100 (default)
Commission costs are factored into backtest results
Best Practices
Start Small: Begin with minimum capital and conservative risk settings
Test Thoroughly: Backtest across different market conditions and timeframes
Monitor Performance: Track win rate, profit factor, and maximum drawdown
Adjust Parameters: Optimize settings for your specific trading pairs
Use Alerts: Set up notifications to avoid missing opportunities
Manage Emotions: Follow the strategy rules consistently without override
Recommended Markets
High liquidity cryptocurrency pairs (BTC, ETH major pairs)
Assets with clear trending behavior
Markets with sufficient volume for scalping
Timeframes: 1H to 4H charts recommended
Risk Reminder
Scalping requires:
Quick decision-making
Tight risk management
Consistent discipline
Understanding of market microstructure
Proper capitalization
Always practice proper risk management. The strategy includes safety features, but no system can eliminate trading risk entirely. Trade responsibly.

MA Crossover Scalper [4H]//@version=5
indicator("MA Crossover Scalper ", overlay=false)
// Market Cap Filter (Volume as proxy)
volumeValid = volume >= 500000 and volume <= 4000000
// MA Crossover System
ma9 = ta.sma(close, 9)
ma21 = ta.sma(close, 21)
bullishCross = ta.crossover(ma9, ma21) and close > ma21
bearishCross = ta.crossunder(ma9, ma21) and close < ma21
// Volume Confirmation
volumeSpike = volume > ta.sma(volume, 20) * 1.3
// Final Signals
bullSignal = bullishCross and volumeSpike and volumeValid
bearSignal = bearishCross and volumeSpike and volumeValid
// Output for Screener
plot(bullSignal ? 1 : 0, "Bull MA Cross", color=color.green)
plot(bearSignal ? 1 : 0, "Bear MA Cross", color=color.red)

Auto Trend & Scalping Pro Atilla SPECIALAUTO TREND & SCALPING PRO — ATILLA SPECIAL EDITION
Auto Trend & Scalping Pro is an advanced, multi-confirmation algorithm designed for fast scalping (1m–5m) and reliable trend-following (15m–4h).
This special edition is custom-optimized for Atilla, combining EMA structure, momentum indicators, and volatility filters to generate clean, high-accuracy trading conditions.
---
🔥 Core Features
• Multi-EMA Trend Engine (13/50/200)
Analyzes the structure of the trend and generates a 0–200 Trend Power Score:
0–50 → Weak
50–100 → Medium
100–170 → Strong
170–200 → Very Strong
• 4-Indicator Confirmation Voting
The system uses:
MACD (momentum shift)
RSI (zone pressure)
STC (smooth trend phase)
ATR (volatility strength)
Each indicator votes Bull / Bear.
Total votes produce a 0–100% confirmation power.
• Sideways Market Filter
Auto-detects consolidation using:
EMA distance %
ATR volatility %
RSI 45–55 neutral zone
When sideways → All signals are blocked to avoid fake entries.
• Auto “LONG READY / SHORT READY” States
Signals activate ONLY when:
Trend is strong
Indicators confirm the direction
Market is not sideways
This eliminates noise and prevents false entries.
---
🟩 Real-Time Dashboard (Top-Right Panel)
Displays:
Market Mode (LONG READY / SHORT READY / WAIT / SIDEWAYS STOP)
EMA Power
Confirmation Strength (%)
MACD / RSI / STC / VOL status
Trend strength & filter state
All updates in real time on every candle.
---
⚡️ Scalping Optimized
Perfect for:
1 minute
3 minute
5 minute Ultra fast trend reading & correction detection.
Also stable on:
15m
30m
1H–4H (trend-following mode)
Works on all crypto pairs including BTC, ETH, BNB, SOL, AVAX, ADA, and more.
---
📌 Extra Notes
No repaint
Safe entry logic
Filters fake breakouts
Professional-grade clarity

Algosnipe trading day scalperThe Algosnipe Trading Day Scalper is an intraday trading strategy designed for active traders who aim to capture short-term price movements within the trading session. It blends price action, volatility, and volume-based logic to identify high-probability entry and exit zones while minimizing exposure time in the market.

Nifty Futures Momentum ScalperNifty Futures Momentum Scalper
Backtesting
VPA , RSI, momentum trades with EMA crossover

💎 Trend Master Pro Scalping MTFTrend Master Pro Scalping MTF is a professional-grade indicator designed for intraday trading and scalping, optimized for 1M, 5M, and 15M timeframes. It combines multiple technical filters to provide high-confidence breakout and trend signals with visual clarity.
Key Features:
Multi-indicator analysis: EMA, RSI, ATR, SuperTrend, and volume.
Multi-Timeframe (MTF) filter: signals are validated only if the higher timeframe trend is aligned.
Clear visual signals: colored triangles and dynamic labels showing signal strength: A++, A+, A, B.
Confirmation dashboard: instantly see EMA trend, RSI strength, volume, ATR activity, SuperTrend direction, and final signal on your chart.
Reliable alerts: fixed alert messages compatible with TradingView, avoiding Pine Script errors.
Customizable parameters: adjust EMA, RSI, ATR, volume, and SuperTrend settings to match your scalping or day trading style.
How to Use:
Select your desired timeframe: 1M, 5M, or 15M.
Look for signals rated A++ or A+ for maximum probability.
Confirm trends using labels and the dashboard before entering trades.
Receive real-time notifications via alerts when confirmed signals occur.
Benefits:
Ideal for quick scalping and intraday strategies.
Reduces false signals with MTF trend filtering.
Professional visualization for fast and confident decision-making.
Recommendations:
Test on a demo account before trading live.
Adjust parameters to fit your asset and timeframe.
Combine with proper risk management strategies.

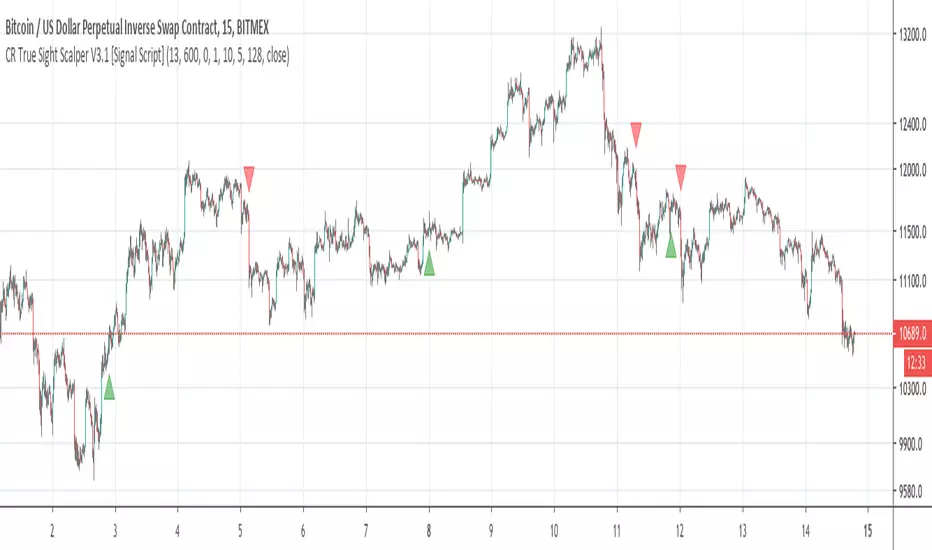
15-Min RSI Scalper [SwissAlgo]15-Min RSI Scalper
Tracks RSI Momentum Loss and Gain to Generate Signals
-------------------------------------------------------
WHAT THIS INDICATOR CALCULATES
This indicator attempts to identify RSI directional changes (RSI momentum) using a step-by-step "ladder" method. It reads RSI(14) from the next higher timeframe relative to your chart. On a 15-minute chart, it uses 1-hour RSI. On a 5-minute chart, it uses 15-minute RSI, and so on.
How the ladder logic works:
The indicator doesn't track RSI all the time. It only starts tracking when RSI crosses into potentially extreme territory (these are called "events" in the code):
For sell signals : when RSI crosses above a dynamic upper threshold (typically between 60-80, calculated as the 90th percentile of recent RSI)
For buy signals : when RSI crosses below a dynamic lower threshold (typically between 20-40, calculated as the 10th percentile of recent RSI)
Once tracking begins, RSI movement is divided into 2-point steps (boxes). The indicator counts how many boxes RSI climbs or falls.
A signal generates only when:
RSI reverses direction by at least 2 boxes (4 RSI points) from its extreme
RSI holds that reversal for 3 consecutive confirmed bars
Example: Dynamic threshold is at 68. RSI crosses above 68 → tracking starts. RSI climbs to 76 (4 boxes up). Then it drops back to 72 and stays below that level for 3 bars → sell signal prints. The buy signal works the same way in reverse.
-------------------------------------------------------
SIGNAL GENERATION METHODOLOGY
Sell Signal (Red Triangle)
RSI crosses above a dynamic start level (calculated as the 90th percentile of the last 1000 bars, constrained between 60-80)
Indicator tracks upward progression in 2-point boxes
RSI reverses and drops below a boundary 2 boxes below the highest box reached
RSI remains below that boundary for 3 confirmed bars
Red triangle plots above price
Reset condition: RSI returns below 50
Buy Signal (Green Triangle)
RSI crosses below a dynamic start level (10th percentile of last 1000 bars, constrained between 20-40)
Indicator tracks downward progression in 2-point boxes
RSI reverses and rises above a boundary 2 boxes above the lowest box reached
RSI remains above that boundary for 3 confirmed bars
Green triangle plots below price
Reset condition: RSI returns above 50
-------------------------------------------------------
TECHNICAL PARAMETERS
All parameters are hardcoded:
RSI Period: 14
Box Size: 2 RSI points
Reversal Threshold: 2 boxes (4 RSI points)
Confirmation Period: 3 bars
Reset Level: RSI 50
Sell Start Range: 60-80 (dynamic)
Buy Start Range: 20-40 (dynamic)
Lookback for Percentile: 1000 bars
Note: Since the code is open source, users can modify these hardcoded values directly in the script to adjust sensitivity. For example, increasing the confirmation period from 3 to 5 bars will produce fewer but more conservative signals. Decreasing the box size from 2 to 1 will make the indicator more responsive to smaller RSI movements.
-------------------------------------------------------
KEY FEATURES
Automatic Higher Timeframe RSI
When applied to a 15-minute chart, the indicator automatically reads 1-hour RSI data. This is the next standard timeframe above 15 minutes in the indicator's logic.
Dynamic Adaptive Start Levels
Sell signals use the 90th percentile of RSI over the last 1000 bars, constrained between 60-80. Buy signals use the 10th percentile, constrained between 20-40. These thresholds recalculate on each bar based on recent data.
Ladder Box System
RSI movements are tracked in 2-point boxes. The indicator requires a 2-box reversal followed by 3 consecutive bars maintaining that reversal before generating a signal.
Dual Signal Output
Red down-triangles plot above price when the sell signal conditions are met. Green up-triangles plot below the price when buy signal conditions are met.
-------------------------------------------------------
REPAINTING
This indicator does not repaint. All calculations use "barstate.isconfirmed" to ensure signals appear only on closed bars. The request.security() call uses lookahead=barmerge.lookahead_off to prevent forward-looking bias.
-------------------------------------------------------
INTENDED CHART TIMEFRAME
This indicator is designed for use on 15-minute charts. The visual reminder table at the top of the chart indicates this requirement.
On a 15-minute chart:
RSI data comes from the 1-hour timeframe
Signals reflect 1-hour momentum shifts
3-bar confirmation equals 45 minutes of price action
Using it on other timeframes will change the higher timeframe RSI source and may produce different behavior.
-------------------------------------------------------
WHAT THIS INDICATOR DOES NOT DO
Does not predict future price movements
Does not provide entry or exit advice
Does not guarantee profitable trades
Does not replace comprehensive technical analysis
Does not account for fundamental factors, news events, or market structure
Does not adapt to all market conditions equally
-------------------------------------------------------
EDUCATIONAL USE
This indicator demonstrates one approach to momentum reversal detection using:
Multi-timeframe analysis
Adaptive thresholds via percentile calculation
Step-wise momentum tracking
Multi-bar confirmation logic
It is designed as a technical study, not a trading system. Signals represent calculated conditions based on RSI behavior, not trade recommendations. Always do your own analysis before taking market positions.
-------------------------------------------------------
RISK DISCLOSURE
Trading involves substantial risk of loss. This indicator:
Is for educational and informational purposes only
Does not constitute financial, investment, or trading advice
Should not be used as the sole basis for trading decisions
Has not been tested across all market conditions
May produce false signals, late signals, or no signals in certain conditions
Past performance of any indicator does not predict future results. Users must conduct their own analysis and risk assessment before making trading decisions. Always use proper risk management, including stop losses and position sizing appropriate to your account and risk tolerance.
MIT LICENSE
This code is open source and provided as-is without warranties of any kind. You may use, modify, and distribute it freely under the MIT License.
