QuantMotions - Smart Money BlocksSmart Money Blocks – Clean Edition is a minimalistic, high-precision Smart Money Concepts (SMC) tool designed for traders who want clean and reliable market structure signals without chart clutter.
This script detects and visualizes Order Blocks, Fair Value Gaps (FVGs), and Liquidity Levels using a strictly filtered, volume-based institutional logic.
Unlike many SMC indicators that overload the chart with noise, this version is built to stay fast, clean, and accurate — ideal for both scalpers and higher-timeframe traders.
🔍 Features
✔ Institutional Order Block Detection
• Identifies bullish and bearish order blocks
• Uses high-volume + price-displacement confirmation
• OBs extend forward and deactivate when broken
• Includes volume + tick range info-box
✔ Fair Value Gaps (FVG)
• Auto-detects bullish and bearish FVGs
• Marks imbalance zones until they are fully filled
• Clean, non-intrusive visualization
✔ Liquidity Levels
• Smart swing-high/swing-low liquidity detection
• Tracks touches to distinguish strong vs weak levels
• Marks support/resistance liquidity with labels only (no chart clutter)
⚙️ Clean & Minimal Design
This script is optimized for a clean workflow:
• No volume profile
• No BOS/CHOCH spam
• No unused SMC elements
• Only high-value SMC signals
• Clean color theme for dark charts
The goal is to provide only what matters, nothing more.
📈 Use Cases
• Smart Money / ICT style trading
• Scalping (1s – 1m)
• Intraday / London & New York session trading
• Swing trading
• Market structure analysis
• Liquidity and imbalance mapping
Whether you're identifying points of interest (POIs), building a bias, or mapping high-probability reaction zones — this tool helps you see structure clearly.
🔔 Alerts Included
• Order Block creation
• FVG creation
• Price touching an active Order Block
• Volume surge
• Institutional candle detection
• Structure break detection
Great for automation or bias confirmation.
🧠 Why This Script?
Many SMC indicators try to do everything — which often results in clutter, lag, and unreliable signals.
This edition focuses on precision, clarity, and real usability.
The logic is light, efficient, and suited for real-time execution on very fast charts.
📌 Note
This tool does not generate trade signals by itself.
It is designed as a market structure map for traders who already understand Smart Money principles such as:
• Displacement
• Imbalance
• Institutional candles
• OB mitigation
• Liquidity sweeps
Use it as part of your confluence system.
In den Scripts nach "scalp" suchen

SLAW TRADING SCALP-XSLAW TRADING SCALP-X – Multi-Filter Scalping Suite
SLAW TRADING SCALP-X is an intraday scalping tool designed for fast markets (crypto, FX, indices) on lower timeframes such as 1m–5m charts. It combines multiple classic concepts into a single, rule-based framework and only prints signals when several conditions agree.
The script uses:
Heikin Ashi structure to smooth noise and detect bullish/bearish candle bias.
Dual EMAs (fast & slow) to define the main trend and to filter trades in the direction of that trend.
Stochastic and MACD as momentum filters. Both can vote for long/short, contributing to a combined momentum score.
Swing / pivot detection (local highs/lows and fractals) to locate potential exhaustion zones and entries near short-term reversals.
ATR-based volatility filter that ignores “dead” low-volatility periods and overly explosive candles, adapting automatically across different markets.
Candle-quality filter that checks body/wick ratios to avoid extreme wick manipulation and very small bodies.
A momentum score is built from Stochastic, MACD and swing conditions. Long or short signals are only allowed when the score reaches a configurable minimum, the trend filter agrees, price is close to the fast EMA, volatility is inside a healthy range, and the candle passes the body/wick quality checks.
The script also contains signal-management logic:
Maximum number of consecutive signals in the same direction (to avoid endless buying or selling in trends).
Minimum bar distance between two signals (to reduce over-trading and clustering).
When all filters line up, the indicator plots “L” and “S” labels on the chart and exposes corresponding alertconditions (“LONG” and “SHORT”) so traders can connect it to webhooks or bots.
This script is intended as a tool for discretionary traders, not an automatic profit guarantee. It works best when combined with your own risk management, session filters and higher-timeframe analysis. Nothing in this indicator is financial advice; always test on a demo account and adapt the parameters to your market and timeframe.

GRAM SCALP_PDH/PDL/P.POC/P.VAL/P.VAH_9/21EMA)This is a simple scalping strategy for futures markets (e.g., MNQ/ES), designed for prop firm challenges that require consistency and good R/R. It focuses on intraday trades during NY session (9:30 ET onward), using bias, EMAs, and key levels from prior Globex session (18:00–17:00 ET).
Goal: Set-and-forget limit orders in bias direction, aiming for small, consistent wins.
Daily Bias (Trend Detection):
Based on the first 15-min candle (9:30–9:45 ET).
If close > open (green): LONG ONLY bias – background shades green, label says "LONG ONLY".
If close < open (red): SHORT ONLY bias – background shades red, label says "SHORT ONLY".
Trade only in bias direction to avoid counter-trend risks. No bias? Sit out.
EMAs for Entries/Confirmation:
9 EMA (orange): Fast line for short-term trend/pullbacks.
21 EMA (purple): Slower line for overall direction.
Entry idea: Wait for price to pull back to 9/21 EMA in bias direction, then enter on bounce/break (e.g., long above EMA on green bias).
Use as dynamic support/resistance – don't trade if price is far from EMAs.
Key Levels from Prior Session (Globex 18:00–17:00 ET):
PDH (Previous Day High): Gray line – potential resistance/target for longs.
PDL (Previous Day Low): Gray line – potential support/target for shorts.
Volume Profile (VP):
POC (Point of Control, orange): Highest volume price – strong magnet; price often returns here.
VAH (Value Area High, fuchsia circles): Top of 70% volume range – resistance; break above = bullish.
VAL (Value Area Low, fuchsia circles): Bottom of 70% volume range – support; break below = bearish.
Use levels for entries (e.g., bounce off VAL for long), stops (behind level), or targets (e.g., aim for POC/VAH).
Trading Rules:
Session: NY open (9:30 ET) to close (16:00 ET). Avoid news/high volatility.
Bias Only: After 9:45 ET, check label/color – trade longs on green, shorts on red.
Entries: Set limit orders at key levels/EMAs in bias direction. E.g., long bias: Buy limit at VAL or EMA pullback.
Risk Management:
Stop Loss: Behind nearest level (e.g., below VAL for long) or fixed 10-20 ticks.
Take Profit: 1:2 risk-reward or at next level (e.g., PDH/POC).
Position Size: 1-2% risk per trade; max 5 trades/day for prop rules.
Exits: Trail with EMAs or exit at EOD. No overnight holds.
Avoid: Choppy markets, gaps through levels, or no clear bias.
Why It Works:
Bias filters bad trades; EMAs confirm momentum; VP/PDH/PDL provide high-probability zones based on where volume/price settled overnight.
Simple, mechanical – ideal for prop challenges (rules on drawdown, consistency).
Backtest on 2-min charts; aim for 60%+ win rate on small scalps (5-20 ticks).
Customize in indicator settings (e.g., VP bin size, line colors). Test on demo before live. Not financial advice – trade at own risk.10 web pages

Ata✨ScalpingТолько для часовика! Скальп на движении.
Ata✨Scalping is a multi-functional scalping indicator for TradingView.
It features customizable moving averages (SMA, EMA, WMA, HMA), a visual volume profile, and automatic support/resistance level detection with strength ratings.
The script is designed for active traders and scalpers, providing clear visual cues for trend, volume, and key price levels, as well as optional breakout alerts.

Kronos Scalper (RAVINDRA KHADSE) 11.11.2025Nice — below is a ready-to-copy TradingView Pine Script (v5) strategy named “Kronos Scalper”.
It’s a self-contained scalping strategy (non-repainting) with configurable EMAs trend filter, RSI entry filter, ATR-based stop loss / take profit, optional trailing stop, plots and entry/exit labels. Drop it into TradingView’s Pine editor and Add to Chart → Strategy Tester.

Real-Time EMA Cross Strategy For Fast Scalping📊 Overview
A professional-grade EMA crossover strategy with real-time execution capabilities. Designed for traders who need instant signal execution and seamless position management, this strategy adapts to any trading style with fully customizable EMA periods.
⚡ Core Features
Instant Execution Technology: Enter/exit positions immediately when signals occur
Seamless Position Switching: Automatically reverses positions without gaps or delays
Customizable EMA Periods: Adapt to any market or timeframe with adjustable settings
Real-Time & Bar-Close Modes: Choose your execution preference
Smart Position Management: No overlapping positions, clean entries and exits
Professional Dashboard: Live monitoring of indicators and position status
🎯 Ideal For
Scalpers requiring instant execution
Day traders seeking responsive strategies
Swing traders who need reliable crossover signals
Anyone looking for a clean, professional trading system
💎 What Makes This Special
No Lag: Real-time mode executes trades the moment crossover occurs
Clean Code: Optimized Pine Script v5 with best practices
Visual Clarity: Color-coded zones, clear signal markers, and info panel
Flexibility: Works across all timeframes and markets
Professional Grade: Includes proper position sizing and risk management
📈 How It Works
Long Signal: Fast EMA crosses above Slow EMA
Short Signal: Fast EMA crosses below Slow EMA
Position Management: Automatic reversal on opposite signals
Execution Options: Choose between instant or bar-close execution
⚙️ Customization
Adjust both EMA periods to match your strategy (2/5, 4/9, 9/21, 12/26, etc.)
Toggle real-time execution on/off
Full control over position sizing
Customizable visual elements
🔔 Built-in Alerts
Long entry signals
Short entry signals
Position reversal notifications
📝 Tips for Best Results
Lower timeframes (1-15min) for scalping with fast EMAs
Higher timeframes (1H-4H) for swing trading with slower EMAs
Test different EMA combinations to find your edge
Always use proper risk management
🚀 Version 3 Improvements
Enhanced crossover detection algorithm
Improved real-time execution logic
Better position management
Cleaner visual interface
More reliable signal generation

MACD Volume VWAP Scalping (2min) by Obiii📘 Strategy Description (for TradingView)
MACD Volume VWAP Scalping Strategy (2-Minute Intraday Momentum)
This strategy is designed for scalpers and short-term intraday traders who focus on capturing small, high-probability moves during the most active hours of the trading session — typically between 9:45 AM and 11:30 AM (New York time).
The system combines three key momentum confirmations:
MACD crossovers to detect short-term trend shifts,
Volume spikes to validate real market participation, and
VWAP / EMA alignment to filter trades in the direction of the prevailing intraday trend.
🔹 Entry Logic
Long Entry:
MACD line crosses above the signal line
Both MACD and Signal are above zero
Current volume > average of the last 10 candles
Price is above VWAP and (optionally) above EMA 9 and EMA 20
Short Entry:
MACD line crosses below the signal line
Both MACD and Signal are below zero
Current volume > average of the last 10 candles
Price is below VWAP and (optionally) below EMA 9 and EMA 20
🎯 Exit Logic
Fixed Take Profit: +0.25%
Fixed Stop Loss: -0.15% to -0.20%
Optionally, switch to the 5-minute chart after entry to monitor momentum and manage exits more smoothly.
⚙️ Recommended Settings
Timeframe: 2 minutes (entries), 5 minutes (monitoring)
Market Session: 9:45 AM – 11:30 AM EST
Assets: Highly liquid instruments such as SPY, QQQ, NVDA, TSLA, AAPL, or large-cap momentum stocks.
💡 Notes
This is a momentum-based scalping strategy — precision and discipline are key.
It performs best in high-volume environments where clear direction emerges after the morning volatility settles.
The system can be fine-tuned for different profit targets, MACD settings, or volume thresholds depending on volatility.

TrendLock Pro 2 — Dual Trend Confirmation📊 TrendLock Pro 2 — Dual Trend Confirmation
🔒 Trade only when the trend is locked and confirmed
TrendLock Pro is a professional no-repaint indicator designed for traders who want to cut through market noise and only capture validated opportunities.
It combines two powerful filters:
TrendScope (current timeframe) → fast detection of momentum shifts through an intelligent RSI setup.
Flow Guard (higher timeframe) → directional filter that only confirms trades aligned with the macro trend.
👉 The result: you only enter when both trends agree , ensuring dual validation before every trade.
🚀 Key Features
✅ No Repaint : signals remain reliable once printed.
✅ Dual Validation : micro-trend (M1, M5…) confirmed by the macro-trend (M15, M30…).
✅ Smart Filters : reduces false signals against the main trend.
✅ Versatile : ideal for M1 scalping, intraday trading, or swing setups.
✅ Built-in Alerts : get notified only when confirmation is strong.
✅ Clear Visuals : green diamonds for confirmed LONGs, red diamonds for confirmed SHORTs.
🎯 Who is it for?
Scalpers seeking safer entries.
Day traders looking to avoid counter-trend traps.
Swing traders preferring cleaner, filtered setups.
💡 Usage Tips
📉 Using Heikin Ashi candles smooths signals and makes them easier to read.
🛡️ Always place your Stop Loss wisely: the indicator doesn’t predict the future but analyzes real-time multi-timeframe trends.
🎯 Avoid being too greedy with Take Profits — aim for balanced targets to maintain a strong win rate.
⚡ Two trends, one signal. Trade with confirmation.

Foresight Cone (HoltxF1xVWAP) [KedArc Quant]Description:
This is a time-series forecasting indicator that estimates the next bar (F1) and projects a path a few bars ahead. It also draws a confidence cone based on how accurate the recent forecasts have been. You can optionally color the projection only when price agrees with VWAP.
Why it’s different
* One clear model: Everything comes from Holt’s trend-aware forecasting method—no mix of unrelated indicators.
* Transparent visuals: You see the next-bar estimate (F1), the forward projection, and a cone that widens or narrows based on recent forecast error.
* Context, not signals: The VWAP option only changes colors. It doesn’t add trade rules.
* No look-ahead: Accuracy is measured using the forecast made on the previous bar versus the current bar.
Inputs (what they mean)
* Source: Price series to forecast (default: Close).
* Preset: Quick profiles for fast, smooth, or momentum markets (see below).
* Alpha (Level): How fast the model reacts to new prices. Higher = faster, twitchier.
* Beta (Trend): How fast the model updates the slope. Higher = faster pivots, more flips in chop.
* Horizon: How many bars ahead to project. Bigger = wider cone.
* Residual Window: How many bars to judge recent accuracy. Bigger = steadier cone.
* Confidence Z: How wide the cone should be (typical setting ≈ “95% style” width).
* Show Bands / Draw Forward Path: Turn the cone and forward lines on/off.
* Color only when aligned with VWAP: Highlights projections only when price agrees with the trend side of VWAP.
* Colors / Show Panel: Styling plus a small panel with RMSE, MAPE, and trend slope.
Presets (when to pick which)
* Scalp / Fast (1-min): Very responsive; best for quick moves. More twitch in chop.
* Smooth Intraday (1–5 min): Calmer and steadier; a good default most days.
* Momentum / Breakout: Quicker slope tracking during strong pushes; may over-react in ranges.
* Custom: Set your own values if you know exactly what you want.
What is F1 here?
F1 is the model’s next-bar fair value. Crosses of price versus F1 can hint at short-term momentum shifts or mean-reversion, especially when viewed with VWAP or the cone.
How this helps
* Gives a baseline path of where price may drift and a cone that shows normal wiggle room.
* Helps you tell routine noise (inside cone) from information (edges or breaks outside the cone).
* Keeps you aware of short-term bias via the trend slope and F1.
How to use (step by step)
1. Add to chart → choose a Preset (start with Smooth Intraday).
2. Set Horizon around 8–15 bars for intraday.
3. (Optional) Turn on VWAP alignment to color only when price agrees with the trend side of VWAP.
4. Watch where price sits relative to the cone and F1:
* Inside = normal noise.
* At edges = stretched.
* Outside = possible regime change.
5. Check the panel: if RMSE/MAPE spike, expect a wider cone; consider a smoother preset or a higher timeframe.
6. Tweak Alpha/Beta only if needed: faster for momentum, slower for chop.
7. Combine with your own plan for entries, exits, and risk.
Accuracy Panel — what it tells you
Preset & Horizon: Shows which preset you’re using and how many bars ahead the projection goes. Longer horizons mean more uncertainty.
RMSE (error in price units): A “typical miss” measured in the chart’s currency (e.g., ₹).
Lower = tighter fit and a usually narrower cone. Rising = conditions getting noisier; the cone will widen.
MAPE (error in %): The same idea as RMSE but in percent.
Good for comparing different symbols or timeframes. Sudden spikes often hint at a regime change.
Slope T: The model’s short-term trend reading.
Positive = gentle up-bias; negative = gentle down-bias; near zero = mostly flat/drifty.
How to read it at a glance
Calm & directional: RMSE/MAPE steady or falling + Slope T positive (or negative) → trends tend to respect the cone’s mid/upper (or mid/lower) area.
Choppy/uncertain: RMSE/MAPE climbing or jumping → expect more whipsaw; rely more on the cone edges and higher-TF context.
Flat tape: Slope T near zero → mean-revert behavior is common; treat cone edges as stretch zones rather than breakout zones.
Warm-up & tweaks
Warm-up: Right after adding the indicator, the panel may be blank for a short time while it gathers enough bars.
Too twitchy? Switch to Smooth Intraday or increase the Residual Window.
Too slow? Use Scalp/Fast or Momentum/Breakout to react quicker.
Timeframe tips
* 1–3 min: Scalp/Fast or Momentum/Breakout; horizon \~8–12.
* 5–15 min: Smooth Intraday; horizon \~12–15.
* 30–60 min+: Consider a larger residual window for a steadier cone.
FAQ
Q: Is this a strategy or an indicator?
A: It’s an indicator only. It does not place orders, TP/SL, or run backtests.
Q: Does it repaint?
A: The next-bar estimate (F1) and the cone are calculated using only information available at that time. The forward path is a projection drawn on the last bar and will naturally update as new bars arrive. Historical bars aren’t revised with future data.
Q: What is F1?
A: F1 is the indicator’s best guess for the next bar.
Price crossing above/below F1 can hint at short-term momentum shifts or mean-reversion.
Q: What do “Alpha” and “Beta” do?
A: Alpha controls how fast the indicator reacts to new prices
(higher = faster, twitchier). Beta controls how fast the slope updates (higher = quicker pivots, more flips in chop).
Q: Why does the cone width change?
A: It reflects recent forecast accuracy. When the market gets noisy, the cone widens. When the tape is calm, it narrows.
Q: What does the Accuracy Panel tell me?
A:
* Preset & Horizon you’re using.
* RMSE: typical forecast miss in price units.
* MAPE: typical forecast miss in percent.
* Slope T: short-term trend reading (up, down, or flat).
If RMSE/MAPE rise, expect a wider cone and more whipsaw.
Q: The panel shows “…” or looks empty. Why?
A: It needs a short warm-up to gather enough bars. This is normal after you add the indicator or change settings/timeframes.
Q: Which timeframe is best?
A:
* 1–3 min: Scalp/Fast or Momentum/Breakout, horizon \~8–12.
* 5–15 min: Smooth Intraday, horizon \~12–15.
Higher timeframes work too; consider a larger residual window for steadier cones.
Q: Which preset should I start with?
A: Start with Smooth Intraday. If the market is trending hard, try Momentum/Breakout.
For very quick tapes, use Scalp/Fast. Switch back if things get choppy.
Q: What does the VWAP option do?
A: It only changes colors (highlights when price agrees with the trend side of VWAP).
It does not add or remove signals.
Q: Are there alerts?
A: Yes—alerts for price crossing F1 (up/down). Use “Once per bar close” to reduce noise on fast charts.
Q: Can I use this on stocks, futures, crypto, or FX?
A: Yes. It works on any symbol/timeframe. You may want to adjust Horizon and the Residual Window based on volatility.
Q: Can I use it with Heikin Ashi or other non-standard bars?
A: You can, but remember you’re forecasting the synthetic series of those bars. For pure price behavior, use regular candles.
Q: The cone feels too wide/too narrow. What do I change?
A:
* Too wide: lower Alpha/Beta a bit or increase the Residual Window.
* Too narrow (misses moves): raise Alpha/Beta slightly or try Momentum/Breakout.
Q: Why do results change when I switch timeframe or symbol?
A: Different noise levels and trends. The accuracy stats reset per chart, so the cone adapts to each context.
Q: Any limits or gotchas?
A: Extremely large Horizon may hit TradingView’s line-object limits; reduce Horizon or turn
off extra visuals if needed. Big gaps or news spikes will widen errors—expect the cone to react.
Q: Can this predict exact future prices?
A: No. It provides a baseline path and context. Always combine with your own rules and risk management.
Glossary
* TS (Time Series): Data over time (prices).
* Holt’s Method: A forecasting approach that tracks a current level and a trend to predict the next bars.
* F1: The indicator’s best guess for the next bar.
* F(h): The projected value h bars ahead.
* VWAP: Volume-Weighted Average Price—used here for optional color alignment.
* RMSE: Typical forecast miss in price units (how far off, on average).
* MAPE: Typical forecast miss in percent (scale-free, easy to compare).
Notes & limitations
* The panel needs a short warm-up; stats may be blank at first.
* The cone reflects recent conditions; sudden volatility changes will widen it.
* This is a tool for context. It does not place trades and does not promise results.
⚠️ Disclaimer
This script is provided for educational purposes only.
Past performance does not guarantee future results.
Trading involves risk, and users should exercise caution and use proper risk management when applying this strategy.

NIFTY_2min_FVG_Buy_StrategySummary
This strategy is designed for scalping Nifty on a 2-minute chart, focusing exclusively on long entries. The script's purpose is to identify and act on specific bullish reversal patterns based on volume analysis and price action.
Concept & Core Logic
The strategy operates on a two-stage confirmation process:
Volume Absorption: The initial condition seeks to identify potential bullish reversals by detecting signs of selling pressure being absorbed by buyers. This suggests that a downward move may be losing momentum.
Fair Value Gap (FVG) Confirmation: After a volume absorption signal, the strategy waits for a Fair Value Gap (FVG) to appear. A long entry signal is generated only after a candle closes above the FVG zone, serving as confirmation of bullish intent.
Risk Management
The strategy employs a fixed take profit and stop loss for each trade, based on the Nifty underlying price:
Take Profit: The exit signal is triggered when a trade reaches a 25-point profit.
Stop Loss: The exit signal is triggered when a trade reaches a 30-point loss.
Intended Use
This tool is intended for traders who:
Utilize mechanical, rule-based systems for intraday trading and scalping.
Are interested in studying a structured approach that combines volume analysis with price action inefficiencies like Fair Value Gaps.

WaverVanir Alpha Reversal Scalper [ETF Eval Bot]🧠 Strategy Overview:
The WaverVanir Alpha Reversal Scalper is a precision-engineered futures trading bot designed to pass prop firm evaluations, specifically Elite Trader Funding (ETF) via Tradovate integration.
This scalping engine was developed after analyzing over 100+ evaluation trades, and is powered by institutional logic, volume behavior, and adaptive VWAP-based confluence.
🔍 Core Logic:
Directional Bias: Trades long only based on VWAP slope confirmation (to avoid funding-damaging shorts)
Entry Conditions:
Price deviates below VWAP standard deviation
Volume spike exceeds 1.5× 20-period average
Bullish reversal wick detected (smart money pattern)
Exit Management:
Stop Loss: 10-tick precision SL below local low
Take Profit: 2.5R static or dynamic trailing stop
Session Filter: Trades only between 9:00–14:00 ET, avoiding lunch and close traps
📊 Backtest Summary (ESU2025)
Metric Result
Net Profit $9,487.50
Profit Factor 1.66 (longs)
Sharpe Ratio 0.03
Sortino Ratio 0.042
Winning Bias Long-Only
Max Drawdown Under $3,000
Commissions $0 (sim tested)
🧪 Tested across March–July 2025 on CME Mini ES (ESU2025)
🔒 Short trades disabled after review: Net −$7,312.50 loss on shorts alone
✅ Profit factor improves > 60% post-optimization
🔄 Recent Optimizations
❌ Disabled unprofitable short setups
✅ VWAP slope filter added for institutional alignment
✅ Trailing stop logic added (activates after 1.5R)
⏱️ Session filter to reduce market noise
🧠 Designed For:
Passing ETF funding challenges quickly
Avoiding drawdown breaches with controlled risk
Running on TradingView with direct Tradovate integration
🚀 Execution-Ready
This bot runs natively on TradingView. Simply:
Add the Pine Script to your chart
Use a tradable symbol (e.g., ESU2025)
Create an alert using “Order fills”
✅ Enable auto-trading to Tradovate
📡 Learn More
🔗 Powered by VolanX Protocol, the AI-driven infrastructure layer of
🌐 WaverVanir International LLC – where institutional logic meets retail precision.
—
🧠 Want to upgrade this bot to include macros, adaptive entries, or launch in NQ/CL?
💬 Drop a comment or message — let’s build your funding empire.
#ES #Futures #ETF #Funding #PropFirm #TradingBot #VWAP #VolumeProfile #AlphaScalper #WaverVanir #VolanX

Price Exhaustion Envelope [BackQuant]Price Exhaustion Envelope
Visual preview of the bands:
What it is
The Price Exhaustion Envelope (PEE) is a multi‑factor overextension detector wrapped inside a dynamic envelope framework. It measures how “tired” a move is by blending price stretch, volume surges, momentum and acceleration, plus optional RSI divergence. The result is a composite exhaustion score that drives both on‑chart signals and the adaptive width of three optional envelope bands around a smoothed baseline. When the score spikes above or below your chosen threshold, the script can flag exhaustion, paint candles, tint the background and fire alerts.
How it works under the hood
Exhaustion score
Price component: distance of close from its mean in standard deviation units.
Volume component: normalized volume pressure that highlights unusual participation.
Momentum component: rate of change and acceleration of price, scaled by their own volatility.
RSI divergence (optional): bullish and bearish divergences gently push the score lower or higher.
Mode control: choose Price, Volume, Momentum or Composite. Composite averages the main pieces for a balanced view.
Energy scale (0 to 100)
The composite score is pushed through a logistic transform to create an “energy” value. High energy (above 70 to 80) signals a move that may be running hot, while very low energy (below 20 to 30) points to exhaustion on the downside.
Envelope engine
Baseline: EMA of price over the main lookback length.
Width: base width is standard deviation times a multiplier.
Type selector:
• Static keeps the width fixed.
• Dynamic expands width in proportion to the absolute exhaustion score.
• Adaptive links width to the energy reading so bands breathe with market “heat.”
Smoothing: a short EMA on the width reduces jitter and keeps bands pleasant to trade around.
Band architecture
You can toggle up to three symmetric bands on each side of the baseline. They default to 1.0, 1.6 and 2.2 multiples of the smoothed width. Soft transparent fills create a layered thermograph of extension. The outermost band often maps to true blow‑off extremes.
On‑chart elements
Baseline line that flips color in real time depending on where price sits.
Up to three upper and lower bands with progressive opacity.
Triangle markers at fresh exhaustion triggers.
Tiny warning glyphs at extreme upper or lower breaches.
Optional bar coloring to visually tag exhausted candles.
Background halo when energy > 80 or < 20 for instant context.
A compact info table showing State, Score, Energy, Momentum score and where price sits inside the envelope (percent).
How to use it in trading
Mean reversion plays
When price pierces the outer band and an exhaustion marker prints, look for reversal candles or lower‑timeframe confirmation to fade the move back toward the baseline.
For conservative entries, wait for the composite score to roll back under the threshold or for energy to drop from extreme to neutral.
Set stops just beyond the extreme levels (use extreme_upper and extreme_lower as natural invalidation points). Targets can be the baseline or the opposite inner band.
Trend continuation with smart pullbacks
In strong trends, the first tag of Band 1 or Band 2 against the dominant direction often offers low‑risk continuation entries. Use energy readings: if energy is low on a pullback during an uptrend, a bounce is more likely.
Combine with RSI divergence: hidden bullish divergence near a lower band in an uptrend can be a powerful confirmation.
Breakout filtering
A breakout that occurs while the composite score is still moderate (not exhausted) has a higher chance of follow‑through. Skip signals when energy is already above 80 and price is punching the outer band, as the move may be late.
Watch env_position (Envelope %) in the table. Breakouts near 40 to 60 percent of the envelope are “healthy,” while those at 95 percent are stretched.
Scaling out and risk control
Use exhaustion alerts to trim positions into strength or weakness.
Trail stops just outside Band 2 or Band 3 to stay in trends while letting the envelope expand in volatile phases.
Multi‑timeframe confluence
Run the script on a higher timeframe to locate exhaustion context, then drill down to a lower timeframe for entries.
Opposite signals across timeframes (daily exhaustion vs. 5‑minute breakout) warn you to reduce size or tighten management.
Key inputs to experiment with
Lookback Period: larger values smooth the score and envelope, ideal for swing trading. Shorter values make it reactive for scalps.
Exhaustion Threshold: raise above 2.0 in choppy assets to cut noise, drop to 1.5 for smooth FX pairs.
Envelope Type: Dynamic is great for crypto spikes, Adaptive shines in stocks where volume and volatility wave together.
RSI Divergence: turn off if you prefer a pure price/volume model or if divergence floods the score in your asset.
Alert set included
Fresh upper exhaustion
Fresh lower exhaustion
Extreme upper breach
Extreme lower breach
RSI bearish divergence
RSI bullish divergence
Hook these to TradingView notifications so you get pinged the moment a move hits exhaustion.
Best practices
Always pair exhaustion signals with structure. Support and resistance, liquidity pools and session opens matter.
Avoid blindly shorting every upper signal in a roaring bull market. Let the envelope type help you filter.
Use the table to sanity‑check: a very high score but mid‑range env_position means the band may still be wide enough to absorb more movement.
Backtest threshold combinations on your instrument. Different tickers carry different volatility fingerprints.
Final note
Price Exhaustion Envelope is a flexible framework, not a turnkey system. It excels as a context layer that tells you when the crowd is pressing too hard or when a move still has fuel. Combine it with sound execution tactics, risk limits and market awareness. Trade safe and let the envelope breathe with the market.

Clarix 5m Scalping Breakout StrategyPurpose
A 5-minute scalping breakout strategy designed to capture fast 3-5 pip moves, using premium/discount zone filters and market bias conditions.
How It Works
The script monitors price action in 5-minute intervals, forming a 15-minute high and low range by tracking the highs and lows of the first 3 consecutive 5-minute candles starting from a custom time. In the next 3 candles, it waits for a breakout above the 15m high or below the 15m low while confirming market bias using custom equilibrium zones.
Buy signals trigger when price breaks the 15m high while in a discount zone
Sell signals trigger when price breaks the 15m low while in a premium zone
The strategy simulates trades with fixed 3-5 pip take profit and stop loss values (configurable). All trades are recorded in a backtest table with live trade results and an automatically updated win rate.
Features
Designed exclusively for the 5-minute timeframe
Custom 15-minute high/low breakout logic
Premium, Discount, and Equilibrium zone display
Built-in backtest tracker with live trade results, statistics, and win rate
Customizable start time, take profit, and stop loss settings
Real-time alerts on breakout signals
Visual markers for trade entries and failed trades
Consistent win rate exceeding 90–95% on average when following market conditions
Usage Tips
Use strictly on 5-minute charts for accurate signal performance. Avoid during high-impact news releases.
Important: Once a trade is opened, manually set your take profit at +3 to +5 pips immediately to secure the move, as these quick scalps often hit the target within a single candle. This prevents missed exits during rapid price action.

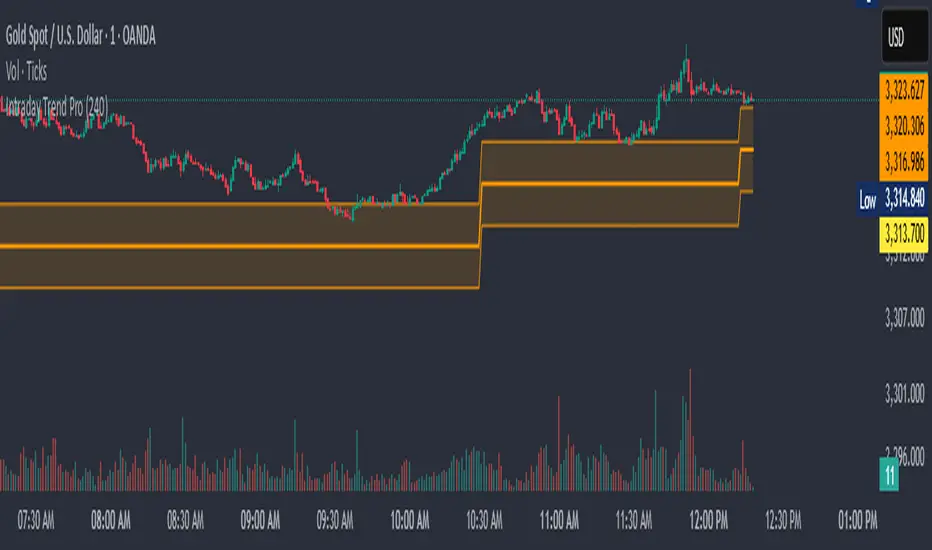
Intraday Trend Pro📈 Intraday Trend Pro — Multi-Timeframe Smart Indicator
Unlock precision in your intraday trading with Intraday Trend Pro, a powerful and versatile indicator built for serious traders. This tool is designed to:
✅ Identify the True Intraday Trend
Quickly and clearly spot bullish or bearish trends using a refined algorithm that filters out noise and false signals.
✅ Smart Entry & Stop Loss Suggestions
The script dynamically suggests optimal entry points and protective stop-loss levels, helping you manage risk and improve trade timing.
✅ Multi-Timeframe Analysis (MTF)
Enable the optional MTF mode to blend higher timeframes with the current chart for a more reliable signal confirmation, enhancing your confidence before entering a trade.
✅ Works Seamlessly Across Assets
Whether you’re trading indices like BankNifty, commodities like XAU/USD, or high-volume stocks, this indicator adjusts to deliver actionable insights.
✅ Customization Made Easy
Input controls allow you to fine-tune the trend settings, select timeframes, and adapt to your unique strategy—whether scalping or holding through the day.
Use Cases:
Confirming trend strength before entering trades
Determining accurate support/resistance for SL placement
Avoiding sideways markets and false breakouts
Aligning trades with higher timeframe momentum
Ideal For:
Intraday traders and scalpers looking for a clean, accurate, and multi-timeframe-aware tool to improve consistency.
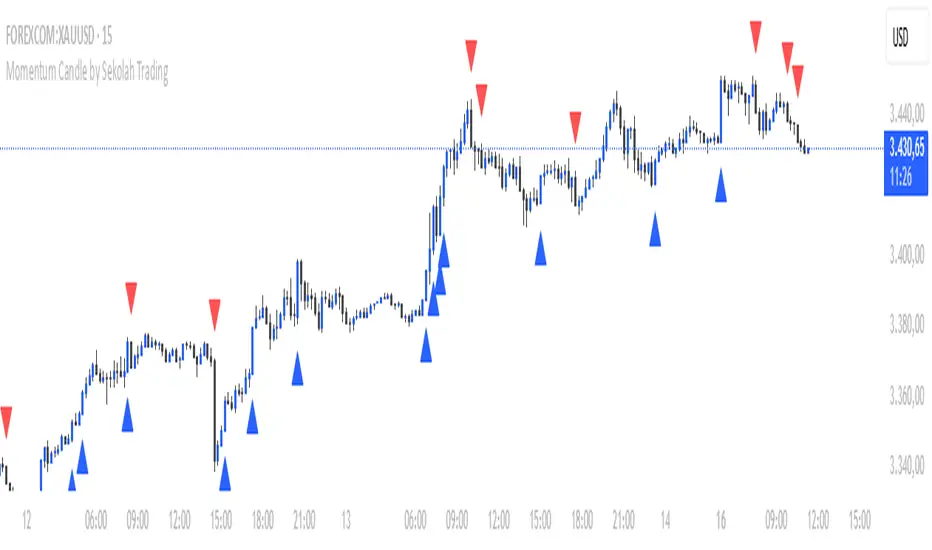
Momentum Candle by Sekolah Trading## 🔷 Introduction
**Momentum Candle by Sekolah Trading** is a proprietary price action tool that identifies high-conviction candles with large bodies and minimal wicks, based on dynamically adjusted thresholds tailored to each pair and timeframe. This script helps traders recognize moments of price acceleration that often precede breakouts, trend continuation, or sharp reversals.
---
## 🔷 What Makes This Script Unique (Originality & Utility)
Unlike traditional candle filters that rely on static size comparisons, this indicator uses:
- **Instrument-specific pip sensitivity**: Automatically detects if the pair is XAUUSD, JPY-based, or other Forex instruments.
- **Timeframe-based calibration**: Adjusts body size thresholds dynamically for 5m, 15m, 30m, and 1h.
- **Wick ratio control**: Validates only candles with short wicks (<30%), filtering indecisive moves.
- **Non-repainting logic**: Signals appear after candle close, with no future data lookahead.
This logic has been tested and refined internally by **Sekolah Trading**, designed for scalpers and intraday traders who rely on clean price action structure.
---
## 🔷 How It Works
1. **Pair & Timeframe Detection**
Adjusts `minRange` dynamically based on:
- Gold (XAUUSD), JPY pairs, or other Forex
- Timeframe: 5m to 1h
2. **Candle Structure Analysis**
- Calculates body = `abs(open - close)`
- Wick = `upper + lower shadows`
- Valid only if wick is under 30% of total candle
3. **Conditions for Signal**
- Body ≥ minRange
- Wick ≤ 30%
- Clear bullish or bearish direction
4. **Plots**
- 🔺 Blue triangle = Bullish momentum candle
- 🔻 Red triangle = Bearish momentum candle
---
## 🔷 How to Use
1. **Add to any 5m–1h chart**, ideally on XAUUSD or major Forex pairs
2. **Wait for signal triangle** to appear at the close of a candle
3. Use with:
- Trend indicators (MA, Supertrend, etc.)
- Support/resistance zones
- Breakout levels
4. **Set alerts** using:
`Momentum Candle (Body)`
---
## 🔷 Why This Script is Closed-Source
This indicator includes proprietary logic created by **Sekolah Trading** for professional and community use:
- Original dynamic pip sensitivity calibration
- Custom multi-condition filtering
- Non-reused, non-public logic with adaptive precision
The source is protected to prevent unauthorized duplication. However, all relevant logic and intent have been clearly explained above as required by TradingView’s House Rules.
---
## 🔷 Disclaimer
This indicator does not provide financial advice or guaranteed signals. Always combine with your own analysis and risk management. Historical performance does not guarantee future results.
---
## 🔷 Suggested Tags
`momentum`, `price action`, `breakout`, `forex`, `xauusd`, `jpy`, `scalping`, `candle`, `non-repainting`, `trend confirmation`
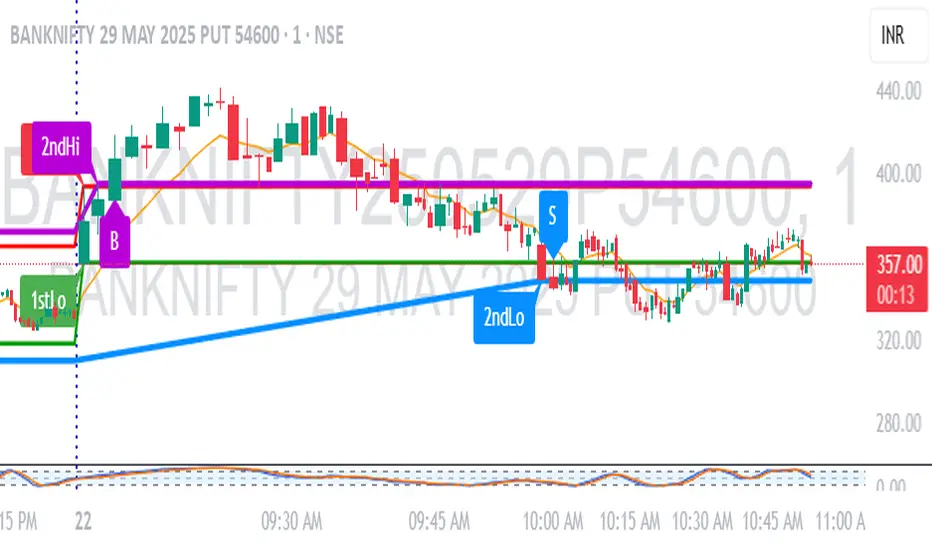
1M Scalp Setup – 2ndHi/2ndLo Breakout1M Scalp Setup – 2ndHi/2ndLo Breakout
This script is designed for 1-minute chart scalpers seeking high-probability intraday breakout setups based on early session price action. The strategy revolves around identifying the first high and low of the day, and then detecting the second breach (2nd high or 2nd low) to anticipate breakout entries.
🔍 Core Logic:
EMA Filter : A configurable EMA (default 8-period) is plotted for trend context.
1st High/Low Detection : Captures the very first high and low of each trading day.
2nd High/Low Markers : Identifies the second time price breaks the initial high or low, acting as a potential signal zone.
Breakout Signals :
A Buy Signal is triggered when price closes above the 2nd high.
A Sell Signal is triggered when price closes below the 2nd low.
Each signal is only triggered once per day to reduce noise and avoid overtrading.
🖌️ Visual Markers:
1stHi and 1stLo : Early session levels (red and green).
2ndHi and 2ndLo : Key breakout reference points (purple and blue).
B and S Labels : Buy and Sell triggers marked in real-time once breakouts occur.
⚙️ Inputs:
EMA Length (default: 8)
Customizable Colors for Buy/Sell signals and key markers
This tool is best used in fast-moving markets or during high-volume sessions. Combine with volume or higher-timeframe confirmation for improved accuracy.
Super Stoch ScalperTheoretically, the higher the number, the stronger the signal.
However, in this mixed up world, the 1 and 2 seems stronger than the 4 at times. That's why I'm still working at McDonald's.
Number over candle = Short.
Number under candle = Long.
Best used for scalping.
God help you with your exits.

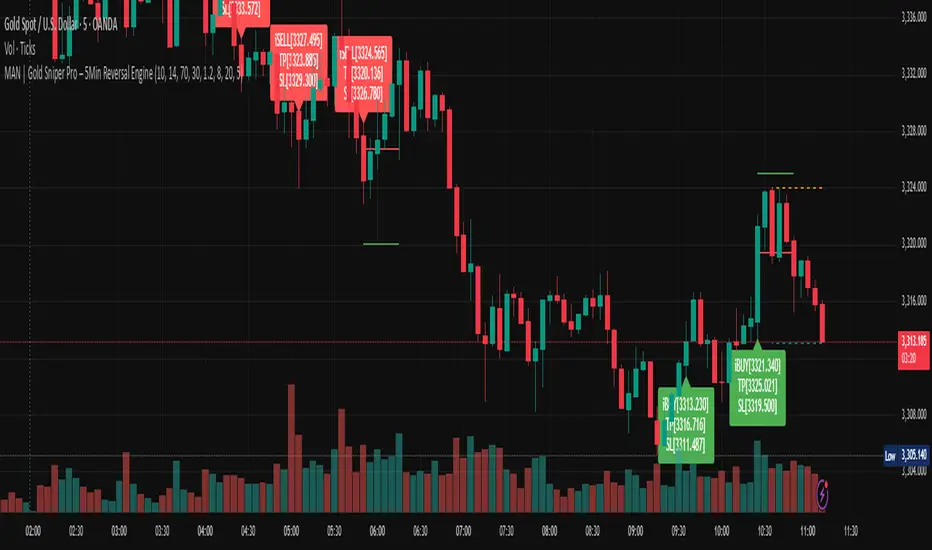
MAN | Gold Sniper Pro – 5Min Reversal EngineThis advanced scalping indicator is designed for high-precision entries and exits on the 5-minute timeframe, combining price action, volume analytics, and momentum filtering.
🔍 Core Features:
Price Action Engine: Detects powerful bullish and bearish engulfing patterns, enhanced with ATR-based body size filters to avoid weak signals.
Dynamic Support/Resistance Zones: Automatically tracks recent high/low zones to confirm trade validity and prevent chasing trades.
Smart RSI Filter: Filters trades based on momentum to avoid buying overbought or selling oversold conditions.
Volume Spike + OBV Filter: Confirms entries with strong volume spikes and OBV (On-Balance Volume) alignment, improving signal quality.
Time-based Session Filter: Optional filter to restrict signals to high-liquidity market hours (configurable).
Auto TP/SL Levels: Calculates Take Profit and Stop Loss dynamically using ATR multipliers, with customizable multipliers per timeframe.
Clear Entry Labels + Optional TP/SL Lines: Visual labels for each signal, with the option to show SL/TP as horizontal lines for precision monitoring.
Real-time Alerts: Set alerts for BUY and SELL conditions — stay informed and trade instantly.
📈 Recommended Usage:
Optimized for Gold (XAUUSD) on the 5-minute chart, but configurable for any fast-moving asset.
Ideal for scalpers and intraday traders seeking high-quality, low-latency entries with built-in protection mechanisms.
Works well in trending or range-bound conditions, thanks to volume and price action synergy.
⚙️ Customizable Parameters:
RSI length & thresholds
ATR-based SL/TP multipliers
Volume spike threshold
Session window
TP/SL visibility toggle
🟢 Built by traders, for traders.
Sharpen your edge with this smart, visual, and momentum-aware scalping tool.
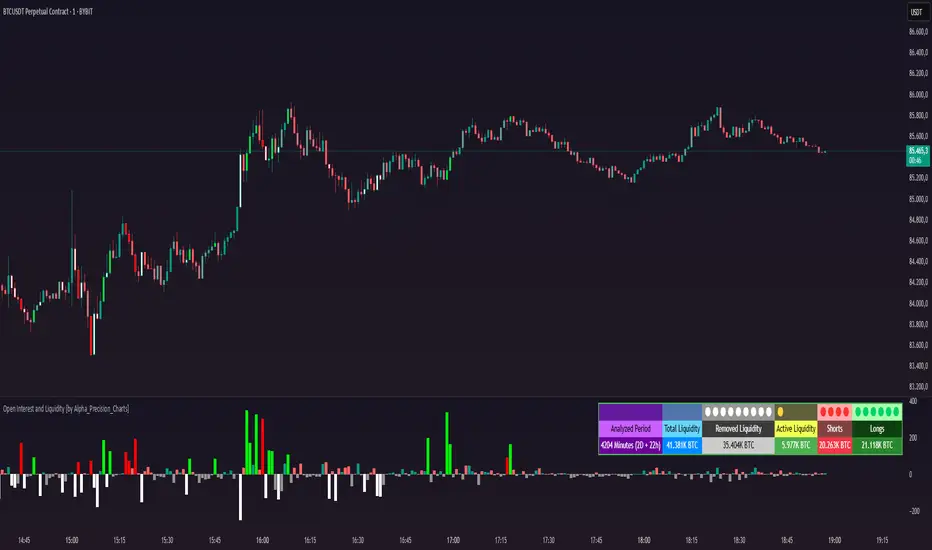
Open Interest and Liquidity [by Alpha_Precision_Charts]Indicator Description: Open Interest and Liquidity
Introduction:
The "Open Interest and Liquidity" indicator is an advanced tool designed for traders seeking to analyze aggregated Open Interest (OI) flow and liquidity in the cryptocurrency market, with a special focus on Bitcoin. It combines high-quality Open Interest data, a detailed liquidity table, and a visual longs vs shorts gauge, providing a comprehensive real-time view of market dynamics. Ideal for scalpers, swing traders, and volume analysts, this indicator is highly customizable and optimized for 1-minute charts, though it works across other timeframes as well.
Key Features:
Aggregated Open Interest and Delta: Leverages Binance data for accuracy, allowing traders to switch between displaying absolute OI or OI Delta, with value conversion to base currency or USD.
Liquidity Table: Displays the analyzed period, active liquidity, shorts, and longs with visual proportion bars, functioning for various cryptocurrencies as long as Open Interest data is available.
Longs vs Shorts Gauge: A semicircle visual that shows real-time market sentiment, adjustable for chart positioning, helping identify imbalances, optimized and exclusive for Bitcoin on 1-minute charts.
Utilities:
Sentiment Analysis: Quickly detect whether the market is accumulating positions (longs/shorts) or liquidating (OI exits).
Pivot Identification: Highlight key moments of high buying or selling pressure, ideal for trade entries or exits.
Liquidity Monitoring: The table and gauge provide a clear view of active liquidity, helping assess a move’s strength.
Scalping and Day Trading: Perfect for short-term traders operating on 1-minute charts, offering fast and precise visual insights.
How to Use:
Initial Setup: Choose between "Open Interest" (candles) or "Open Interest Delta" (columns) in the "Display" field. The indicator defaults to Binance data for enhanced accuracy.
Customization: Enable/disable the table and gauge as needed and position them on the chart.
Interpretation: Combine OI Delta and gauge data with price movement to anticipate breakouts or reversals.
Technical Notes
The indicator uses a 500-period VWMA to calculate significant OI Delta thresholds and is optimized for Bitcoin (BTCUSDT.P) on high-liquidity charts.
Disclaimer
This indicator relies on the availability of Open Interest data on TradingView. For best results, use on Bitcoin charts with high liquidity, such as BTCUSDT.P. Accuracy may vary with lower-volume assets or exchanges.
kurd fx Dynamic EMA StrategyDynamic EMA Strategy Explanation
This TradingView Pine Script indicator, "Dynamic EMA Strategy," is designed to plot Exponential Moving Averages (EMAs) dynamically based on the selected timeframe. It adjusts the EMA periods depending on whether the trader is scalping, swing trading, or position trading.
Functionality
1. Defining EMA Periods Based on Timeframe
The script determines appropriate EMA values based on the selected chart timeframe:
Scalping (1m, 3m, 5m)
Uses EMA 9, EMA 21, and EMA 50 for fast-moving market conditions.
Swing Trading (15m, 30m, 45m)
Uses EMA 50 and EMA 100, suitable for medium-term trend identification.
EMA 3 is disabled (na) in this mode.
Position Trading (1H and higher)
Uses EMA 100 and EMA 200 to identify long-term trends.
EMA 3 is disabled (na) in this mode.
2. EMA Calculation
The script calculates EMA values dynamically:
emaLine1 = ta.ema(close, ema1): Computes the first EMA.
emaLine2 = ta.ema(close, ema2): Computes the second EMA.
emaLine3 = not na(ema3) ? ta.ema(close, ema3) : na: Computes the third EMA only if applicable.
3. Plotting the EMAs
The script overlays the EMAs on the chart:
Blue Line (EMA 1) → Represents the fastest EMA.
Orange Line (EMA 2) → Represents the medium EMA.
Red Line (EMA 3) → Represents the slowest EMA (if applicable).
Each EMA is plotted using plot() with a specific color, linewidth of 2, and plot.style_line for a clean visualization.
Use Case
Scalpers can identify short-term momentum changes.
Swing traders can detect medium-term trends.
Position traders can spot long-term market trends.
This strategy helps traders adjust their EMA settings dynamically without manually changing them for different timeframes.

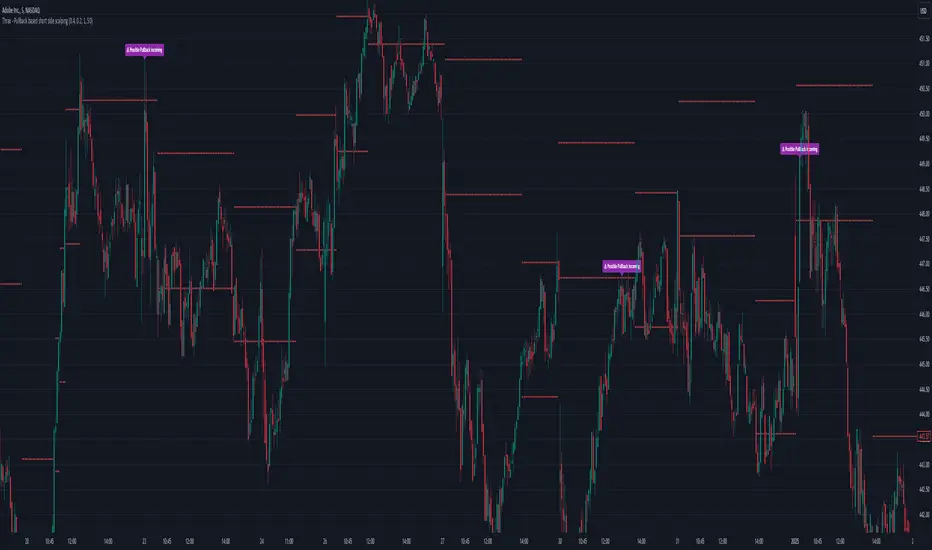
Thrax - Pullback based short side scalping⯁ This indicator is built for short trades only.
⤞ Pullback based scalping is a strategy where a trader anticipates a pullback and makes a quick scalp in this pullback. This strategy usually works in a ranging market as probability of pullbacks occurrence in ranging market is quite high.
⤞ The strategy is built by first determining a possible candidate price levels having high chance of pullbacks. This is determined by finding out multiple rejection point and creating a zone around this price. A rejection is considered to be valid only if it comes to this zone after going down by a minimum pullback percentage. Once the price has gone down by this minimum pullback percentage multiple times and reaches the zone again chances of pullback goes high and an indication on chart for the same is given.
⯁ Inputs
⤞ Zone-Top : This input parameter determines the upper range for the price zone.
⤞ Zone bottom : This input parameter determines the lower range for price zone.
⤞ Minimum Pullback : This input parameter determines the minimum pullback percentage required for valid rejection. Below is the recommended settings
⤞ Lookback : lookback period before resetting all the variables
⬦Below is the recommended settings across timeframes
⤞ 15-min : lookback – 24, Pullback – 2, Zone Top Size %– 0.4, Zone Bottom Size % – 0.2
⤞ 5-min : lookback – 50, pullback – 1% - 1.5%, Zone Top Size %– 0.4, Zone Bottom Size % – 0.2
⤞ 1-min : lookback – 100, pullback – 1%, Zone Top Size %– 0.4, Zone Bottom Size % – 0.2
⤞ Anything > 30-min : lookback – 11, pullback – 3%, Zone Top Size %– 0.4, Zone Bottom Size % – 0.2
✵ This indicator gives early pullback detection which can be used in below ways
1. To take short trades in the pullback.
2. To use this to exit an existing position in the next few candles as pullback may be incoming.
📌 Kindly note, it’s not necessary that pullback will happen at the exact point given on the chart. Instead, the indictor gives you early signals for the pullback
⯁ Trade Steup
1. Wait for pullback signal to occur on the chart.
2. Once the pullback warning has been displayed on the chart, you can either straight away enter the short position or wait for next 2-4 candles for initial sign of actual pullback to occurrence.
3. Once you have initiated short trade, since this is pullback-based strategy, a quick scalp should be made and closed as price may resume it’s original direction. If you have risk appetite you can stay in the trade longer and trial the stops if price keeps pulling back.
4. You can zone top as your stop, usually zone top + some% should be used as stop where ‘some %’ is based on your risk appetite.
5. It’s important to note that this indicator gives early sings of pullback so you may actually wait for 2-3 candles post ‘Pullback warning’ occurs on the chart before entering short trade.
1 (or) 5-Minute Scalping Strategy - KGP1-Minute Scalping Strategy - KGP
Overview: This indicator is designed for short-term traders who engage in 1 (or) 5-minute scalping. It combines several technical analysis tools to provide buy and sell signals, helping traders make informed decisions quickly.
Key Features:
VWAP (Volume Weighted Average Price):
Purpose: VWAP provides the average price a security has traded at throughout the day, based on both volume and price.
Usage: Helps identify the overall trend and potential entry points. When the price is above VWAP, it indicates a bullish trend; when below, it indicates a bearish trend.
RSI (Relative Strength Index):
Purpose: RSI measures the speed and change of price movements, indicating overbought or oversold conditions.
Usage: The RSI values between 30 and 70 are used to filter trades. A value above 70 indicates overbought conditions, while below 30 indicates oversold conditions.
Custom OBV (On Balance Volume):
Purpose: OBV uses volume flow to predict changes in stock price.
Usage: Helps confirm the strength of a trend. Increasing OBV indicates accumulation (buying pressure), while decreasing OBV indicates distribution (selling pressure).
Multi-Timeframe Analysis:
Purpose: Confirms signals by analyzing RSI on a higher timeframe (5-minute chart).
Usage: Ensures that signals on the 1-minute chart align with the broader trend on the 5-minute chart, reducing false signals.
Signals:
Buy Signal:
Triggered when the price crosses above the VWAP, and the RSI is between 50 and 70 on both the 1-minute and 5-minute charts.
Visual Cue: A green “BUY” label appears below the bar.'
Sell Signal:
Triggered when the price crosses below the VWAP, and the RSI is between 30 and 50 on both the 1-minute and 5-minute charts.
Visual Cue: A red “SELL” label appears above the bar.
Alerts:
Buy Alert: Notifies you when a buy signal is detected.
Sell Alert: Notifies you when a sell signal is detected.
Additional Visuals:
VWAP Line: Plotted in blue to show the average price based on volume.
OBV Line: Plotted in purple to indicate volume flow.
RSI Line: Plotted in orange with horizontal lines at 70 (overbought) and 30 (oversold) levels.

Buy-Sell Volume Bar Gauge [By MUQWISHI]▋ INTRODUCTION :
The Buy-Sell Volume Bar Gauge is developed to provide traders with a detailed analysis of volume in bars using a low timeframe, such as a 1-second interval, to measure the dominance of buy and sell for each bar. By highlighting the balance between buying and selling activities, the Buy-Sell Volume Bar Gauge helps traders identify potential volume momentum of a bar; aimed at being a useful tool for day traders and scalpers.
_______________________
▋ OVERVIEW:
_______________________
▋ METHODOLOGY:
The concept is based on bars from a lower timeframe within the current chart timeframe bar, where volume is categorized into Up, Down, and Neutral Volume, with each one displayed as a portion of a column plot. Up Volume is recorded when the price experiences a positive change, Down Volume occurs when the price experiences a negative change, and Neutral Volume is observed when the price shows no significant change.
_______________________
▋ INDICATOR SETTINGS:
(1) Fetch data from the selected lower timeframe. Note: If the selected timeframe is invalid (higher than chart), the indicator will automatically switch to 1 second.
(2) Price Source.
(3) Treating Neutral Data (Price Source) as
Neutral: In a lower timeframe, when the bar has no change in its price, the volume is counted as Neutral Volume.
Previous Move: In a lower timeframe, when the bar has no change in its price, the volume is counted as the previous change; “Up Volume” if the previous change was positive, and “Down Volume” if the previous change was negative.
Opposite Previous Move: In a lower timeframe, when the bar has no change in its price, the volume is counted as the opposite previous change; “Up Volume” if the previous change was negative, and “Down Volume” if the previous change was positive.
(4) Average Volume Length, it's used for lighting/darkening columns in a plot.
(5) Enable Alert.
(7) Total bought (%) Level.
(8) Total Sold (%) Level.
_____________________
▋ COMMENT:
The Buy-Sell Volume Bar Gauge can be taken as confirmation for predicting the next move, but it should not be considered a major factor in making a trading decision.
