Analysis of the latest trend of gold market:
Analysis of gold news: On Tuesday (March 11), spot gold rebounded slightly in the European session and is currently trading around $2909.09/oz. Overnight, the price of gold fell by 0.79%, falling below the $2900 mark. During the session, it once refreshed a low of nearly a week to $2880.19/oz. Zelensky visited Saudi Arabia, and the United States was optimistic about the talks between U.S. and Ukrainian officials. The market's concerns about the geopolitical situation have cooled down; in addition, the market value of the U.S. stock market evaporated by $4 trillion, increasing investors' demand for holding currency, further promoting gold bulls to take profits. This trading day focuses on the vacancies of the U.S. JOLTs in January. In addition, U.S. and Ukrainian officials held talks in Saudi Arabia
Technical analysis of gold:
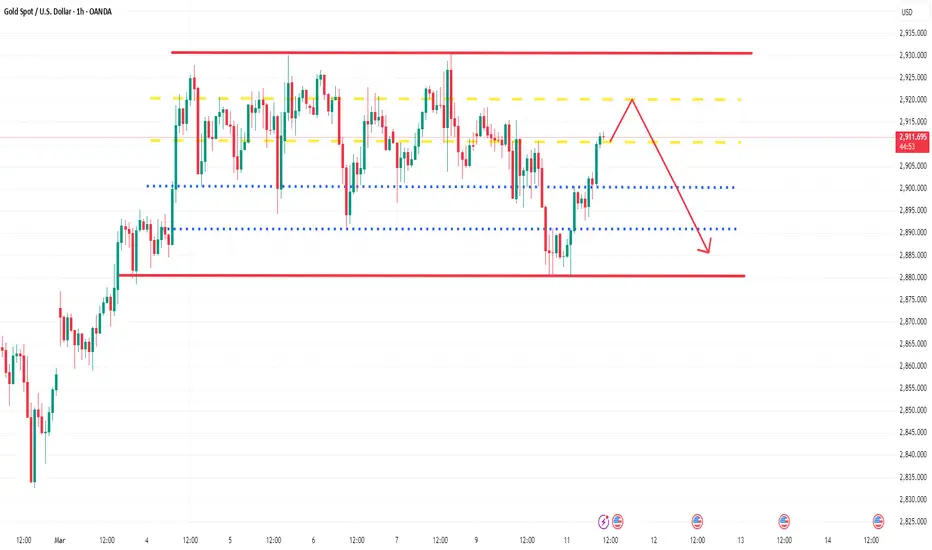
Gold rebounded after testing the support area near 2880 yesterday, and is currently touching around 2910. Gold looks relatively strong. However, gold has not been able to break through the 2920-2930 area for a long time recently. This area has formed an absolute suppression in the short term. In the process of testing support, gold has fallen below 2900 and even 2890 many times. It can be seen that the support below is not solid, and after repeated testing and breaking, the strength of the support below is gradually weakening.
Therefore, after gold rebounds to the 2910-2920 area, the rebound strength may weaken again, and after facing the previous short-term resistance, gold may fall again. Therefore, in short-term trading, we can still short gold in the 2910-2920 area. It is expected that gold will retest 2900-2980. If gold falls below this area during the test, it may even reach the 2870-2860 area.
You can read bottom signals, interpret daily market trends, and share real-time strategies, so you no longer blindly follow the trend.
Analysis of gold news: On Tuesday (March 11), spot gold rebounded slightly in the European session and is currently trading around $2909.09/oz. Overnight, the price of gold fell by 0.79%, falling below the $2900 mark. During the session, it once refreshed a low of nearly a week to $2880.19/oz. Zelensky visited Saudi Arabia, and the United States was optimistic about the talks between U.S. and Ukrainian officials. The market's concerns about the geopolitical situation have cooled down; in addition, the market value of the U.S. stock market evaporated by $4 trillion, increasing investors' demand for holding currency, further promoting gold bulls to take profits. This trading day focuses on the vacancies of the U.S. JOLTs in January. In addition, U.S. and Ukrainian officials held talks in Saudi Arabia
Technical analysis of gold:
Gold rebounded after testing the support area near 2880 yesterday, and is currently touching around 2910. Gold looks relatively strong. However, gold has not been able to break through the 2920-2930 area for a long time recently. This area has formed an absolute suppression in the short term. In the process of testing support, gold has fallen below 2900 and even 2890 many times. It can be seen that the support below is not solid, and after repeated testing and breaking, the strength of the support below is gradually weakening.
Therefore, after gold rebounds to the 2910-2920 area, the rebound strength may weaken again, and after facing the previous short-term resistance, gold may fall again. Therefore, in short-term trading, we can still short gold in the 2910-2920 area. It is expected that gold will retest 2900-2980. If gold falls below this area during the test, it may even reach the 2870-2860 area.
You can read bottom signals, interpret daily market trends, and share real-time strategies, so you no longer blindly follow the trend.
Trade ist aktiv
From the perspective of technical analysis, the technical graph of the gold price trend chart is like a clear marching route map. At this moment, if you are eager to gain profits in the gold market, shorting gold may be the strategy you dream of. Choose to enter the market decisively when the price rebounds to the key resistance level of 2910-2915, and exit the market decisively when the target is 2900-2890. Only in this investment battle can you win the game and reap rich returns. Wish us good luck! Brothers, have you followed me to short gold?Verbundene Veröffentlichungen
Haftungsausschluss
Die Informationen und Veröffentlichungen sind nicht als Finanz-, Anlage-, Handels- oder andere Arten von Ratschlägen oder Empfehlungen gedacht, die von TradingView bereitgestellt oder gebilligt werden, und stellen diese nicht dar. Lesen Sie mehr in den Nutzungsbedingungen.
Verbundene Veröffentlichungen
Haftungsausschluss
Die Informationen und Veröffentlichungen sind nicht als Finanz-, Anlage-, Handels- oder andere Arten von Ratschlägen oder Empfehlungen gedacht, die von TradingView bereitgestellt oder gebilligt werden, und stellen diese nicht dar. Lesen Sie mehr in den Nutzungsbedingungen.