US30 Weekly Analysis: Double Top Breakdown and Bearish Outlook
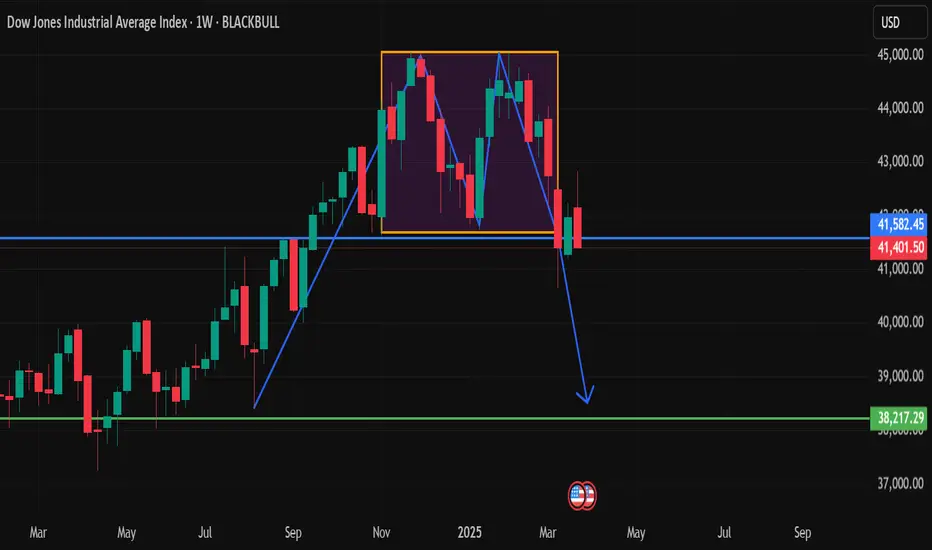
The Dow Jones Industrial Average (US30) has exhibited a clear double top formation on the weekly timeframe, signaling a potential bearish reversal. The price recently broke below the neckline support around 41,400, confirming the pattern and suggesting further downside movement.
Price action
Analysis
1. Double Top Formation
• A double top is a classic reversal pattern that occurs after an extended uptrend.
• The two peaks were formed around 42,819.50, where bullish momentum failed to sustain further highs.
• The rejection from this level indicated that buyers were losing strength.
2. Neckline Break and Confirmation
• The neckline support at 41,400 was a critical level that held price consolidation for some time.
• A break below the neckline has confirmed the bearish structure, signaling further downside potential.
• If the price retests 41,400 and rejects, it could provide another opportunity for short positions.
3. Bearish Target Projection
• The double top pattern suggests a measured move equal to the distance between the peaks and neckline (approximately 1,400-1,500 points).
• This projects a downside target of 38,217, aligning with the next major support zone (green line on the chart).
Trading Strategy: Bearish Continuation
• Entry: Wait for a retest of 41,400 and a rejection with a bearish confirmation candle.
• Stop Loss: Place above 41,800, as a break above invalidates the bearish setup.
• Take Profit: First target 39,500, final target 38,217.
• Risk Management: Use proper position sizing to manage risk in case of a false breakout.
Conclusion
US30 is showing strong bearish momentum after confirming the double top breakdown. A successful retest of 41,400 as resistance will likely accelerate selling pressure towards 38,217. We should watch price action closely for confirmation before entering short positions.
Stay ahead of the market—Follow my channel for free insights~~ Telegram channel link below !
t.me/+jvSU52DTZAphYTc1
youtube.com/@TeamSpark-08
t.me/+jvSU52DTZAphYTc1
youtube.com/@TeamSpark-08
Haftungsausschluss
Die Informationen und Veröffentlichungen sind nicht als Finanz-, Anlage-, Handels- oder andere Arten von Ratschlägen oder Empfehlungen gedacht, die von TradingView bereitgestellt oder gebilligt werden, und stellen diese nicht dar. Lesen Sie mehr in den Nutzungsbedingungen.