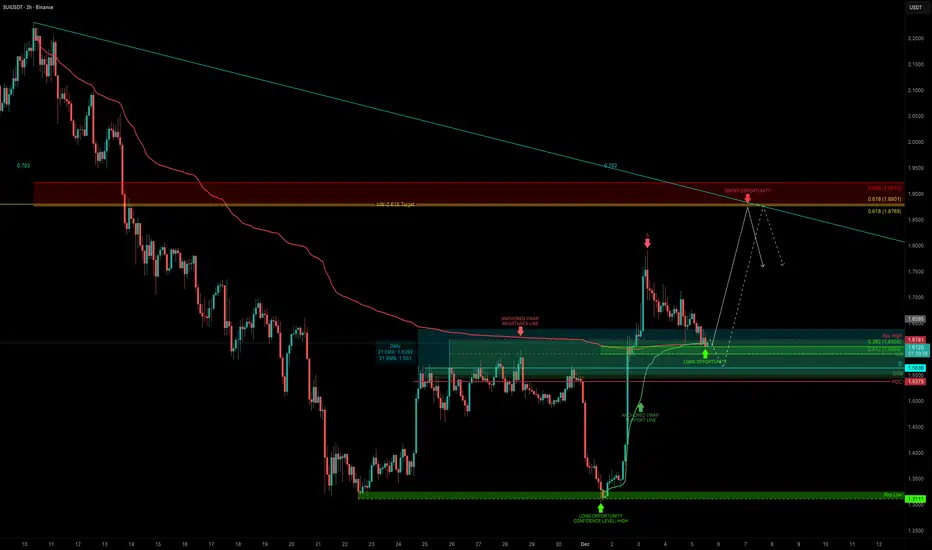
SUI just delivered one of the cleanest moves. After sweeping the liquidity low at $1.3111, price launched nearly +40% in under two days, ripping through a full 5-wave impulse and breaking market structure. Now that the fast move is done, the real question is:
Where’s the next high-probability setup?
To answer that, we break down the support/resistance zones, VWAP structure, Fibonacci levels, and market cap confluence that are now forming.
1. The Key Support Cluster at $1.60
To map the next setup, we first look for strong support. And right now, $1.60 is loaded with confluence:
Market Cap Confluence
I like using market caps as macro support/resistance, and these levels line up beautifully. All in all, $1.55–$1.60 is shaping up as the main demand zone.
2. Upside Target → the 0.618 Fib
3. Risk Management
An entry between $1.60-$1.55 with an SL below the POC / order block allows for:
Summary
SUI swept a major low, completed a sharp impulse, and broke market structure. Now it’s retracing into what looks like a high-confluence long zone around $1.55–$1.60. If this support zone holds, the next target is $1.87, giving a clean and logical long setup with solid R:R.
🔍 Indicators used
➡️ Available for free. You can find it on my profile under “Scripts” and apply it directly to your charts for extra confluence when planning your trades.
_________________________________
💬 If you found this helpful, drop a like and comment!
To answer that, we break down the support/resistance zones, VWAP structure, Fibonacci levels, and market cap confluence that are now forming.
1. The Key Support Cluster at $1.60
To map the next setup, we first look for strong support. And right now, $1.60 is loaded with confluence:
- Anchored VWAPs from both the swing low ($1.3039) and swing high ($2.231) meet at roughly $1.60
- Fibonacci Retracement
The 0.382 retracement of the entire impulse sits exactly at $1.60. After fast moves, holding the 0.382 is typically what you want to see for bullish continuation.
- Dynamic EMAs & SMAs: Daily 21 EMA → $1.64, Daily 21 SMA → $1.55.
These are dynamic tools, so they shift over time, but both are already closing in on the same zone.
- Daily level at $1.5636
- POC of the previous range at $1.5375.
Both overlap with the daily order block, adding confidence.
- Monthly Anchored VWAP.
Currently around $1.5782, giving this area even more weight.
Market Cap Confluence
- $1.60 ≈ 6B market cap
- $1.87 ≈ 7B market cap
I like using market caps as macro support/resistance, and these levels line up beautifully. All in all, $1.55–$1.60 is shaping up as the main demand zone.
2. Upside Target → the 0.618 Fib
- Using the retracement from the downward move
($2.231 → $1.3039), the 0.618 Fib sits at $1.8768.
- This also lines up with the 7B market cap and previous resistance structure.
That makes it the main target for the next leg up.
3. Risk Management
An entry between $1.60-$1.55 with an SL below the POC / order block allows for:
- R:R between 1:4 and 1:6 (depending on how you ladder)
- Clear invalidation
- Strong structural backing
- Multiple layers of confluence
Summary
SUI swept a major low, completed a sharp impulse, and broke market structure. Now it’s retracing into what looks like a high-confluence long zone around $1.55–$1.60. If this support zone holds, the next target is $1.87, giving a clean and logical long setup with solid R:R.
🔍 Indicators used
- Multi Timeframe 8x MA Support Resistance Zones [SiDec] → to identify support and resistance zones such as the daily 21 EMA/SMA.
➡️ Available for free. You can find it on my profile under “Scripts” and apply it directly to your charts for extra confluence when planning your trades.
_________________________________
💬 If you found this helpful, drop a like and comment!
Anmerkung
POC bounce:Trade wurde manuell geschlossen
Closed the trade almost at breakeven after seeing no real follow through and a weak reaction. Waiting for the next setup.🏆 Mastering Fibonacci for precision trading
🔹 Sharing high-probability trade setups
⚡ Unlock the power of technical analysis!
🔹 Sharing high-probability trade setups
⚡ Unlock the power of technical analysis!
Verbundene Veröffentlichungen
Haftungsausschluss
Die Informationen und Veröffentlichungen sind nicht als Finanz-, Anlage-, Handels- oder andere Arten von Ratschlägen oder Empfehlungen gedacht, die von TradingView bereitgestellt oder gebilligt werden, und stellen diese nicht dar. Lesen Sie mehr in den Nutzungsbedingungen.
🏆 Mastering Fibonacci for precision trading
🔹 Sharing high-probability trade setups
⚡ Unlock the power of technical analysis!
🔹 Sharing high-probability trade setups
⚡ Unlock the power of technical analysis!
Verbundene Veröffentlichungen
Haftungsausschluss
Die Informationen und Veröffentlichungen sind nicht als Finanz-, Anlage-, Handels- oder andere Arten von Ratschlägen oder Empfehlungen gedacht, die von TradingView bereitgestellt oder gebilligt werden, und stellen diese nicht dar. Lesen Sie mehr in den Nutzungsbedingungen.