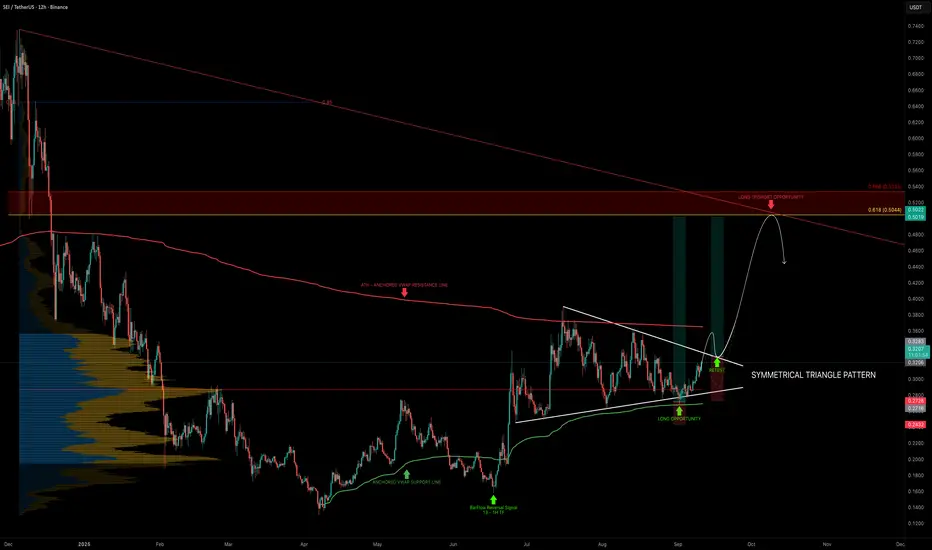
SEI has been consolidating in a symmetrical triangle for the past 78 days, now reaching the apex, signaling that a big move is coming soon.
Price has been trading between two anchored VWAPs:
The POC of the 280-day trading range sits at $0.287, a key pivot level to watch.
Support Confluence
Resistance Confluence
🟢 Long Trade Setup
Technical Insight
_________________________________
💬 If you found this helpful, drop a like and comment!
Price has been trading between two anchored VWAPs:
- From the $0.13 low → acting as support (currently ~$0.27)
- From the ATH → acting as resistance (currently ~$0.365)
The POC of the 280-day trading range sits at $0.287, a key pivot level to watch.
Support Confluence
- Anchored VWAP (from $0.13 low): ~$0.27 (long entry zone already tested)
- POC (280-day range): $0.287 → key stop-loss reference
- Symmetrical triangle breakout retest: ~$0.33 → potential re-entry after breakout
- Fib Speed Resistance Fan 0.618: ~$0.27 → reinforcing support at the anchored VWAP
Resistance Confluence
- 0.618 Fib retracement: $0.5044 → aligns with $0.5 key level
- 3B Market Cap resistance: ~$0.505
- Fair Value Gap (FVG): sitting around $0.5
- Trend-Based Fib Extension 1.0: $0.5 → major target confluence
🟢 Long Trade Setup
- Entry Zone: Retest around $0.33 after breakout
- Stop-Loss: Below $0.287 (POC), to be adjusted after seeing a clear reversal sign.
- Target (TP): $0.50
- Potential Gain: ~+50%
- Timeframe: Could take ~1 month to play out
Technical Insight
- SEI has been compressing for over two months, and volatility is about to expand.
- The ideal entry at $0.27 (anchored VWAP support) has already triggered.
- The next opportunity lies in a triangle breakout + retest around $0.33.
- The $0.50 level stands out as a high-confluence target, combining Fib levels, market cap, FVG, and extension symmetry.
_________________________________
💬 If you found this helpful, drop a like and comment!
Anmerkung
SEI Update — Triangle Breakout Retest in PlaySEI has broken out of the symmetrical triangle pattern, following the mapped projection nicely. Price is now approaching the retest zone.
📌 The $0.33–$0.32 zone stands out as a critical support area → I’d like to see a strong bounce from here to confirm continuation.
I’ve included several take-profit (TP) levels in the chart update for clarity.
Anmerkung
$0.31 is a reversal point with the most confluence: Anmerkung
Golden Pocket Reversal Zone:Anmerkung
SEI Update — Reversal at $0.31 Playing OutAs mentioned earlier, $0.31 was the key reversal point with the strongest confluence and it delivered. Price has already pumped +5% from this level.
The 0.666 Fib speed fan acted as a clean support line, further confirming the setup.
Trade wurde manuell geschlossen
Closed manually after seeing heavy sellingAnmerkung
SEI Update — Testing Range Lows AgainSEI has dropped back to the range lows, retesting the support zone once more. Price is currently trading between the 21 EMA/SMA on the weekly timeframe, a key reversal zone to watch.
On the upside, the 21 EMA/SMA on the monthly timeframe forms a strong resistance cluster between $0.35–$0.40, which will be the zone to reclaim for bullish continuation.
Anmerkung
Key level at $0.28 has been broken. Price is now trading below the 21 Weekly EMA/SMA. Next high-probability long setup sits at the FVG:🏆 Mastering Fibonacci for precision trading
🔹 Sharing high-probability trade setups
⚡ Unlock the power of technical analysis!
🔹 Sharing high-probability trade setups
⚡ Unlock the power of technical analysis!
Verbundene Veröffentlichungen
Haftungsausschluss
Die Informationen und Veröffentlichungen sind nicht als Finanz-, Anlage-, Handels- oder andere Arten von Ratschlägen oder Empfehlungen gedacht, die von TradingView bereitgestellt oder gebilligt werden, und stellen diese nicht dar. Lesen Sie mehr in den Nutzungsbedingungen.
🏆 Mastering Fibonacci for precision trading
🔹 Sharing high-probability trade setups
⚡ Unlock the power of technical analysis!
🔹 Sharing high-probability trade setups
⚡ Unlock the power of technical analysis!
Verbundene Veröffentlichungen
Haftungsausschluss
Die Informationen und Veröffentlichungen sind nicht als Finanz-, Anlage-, Handels- oder andere Arten von Ratschlägen oder Empfehlungen gedacht, die von TradingView bereitgestellt oder gebilligt werden, und stellen diese nicht dar. Lesen Sie mehr in den Nutzungsbedingungen.