Chart Time Frame: 1 Hour
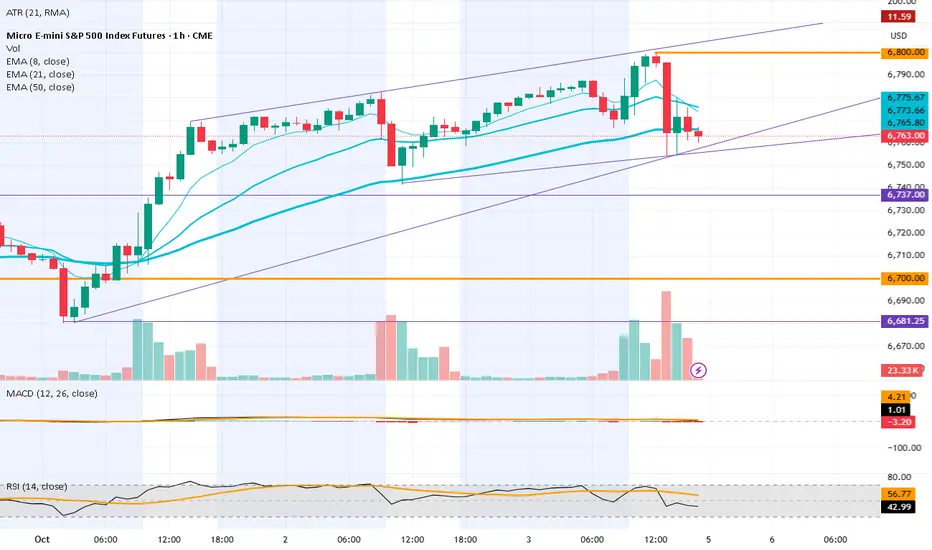
Current Price: 6763 after setting recent ATH at 6800
Daily Candle: Top Heavy Doji with open / close entire in the body of previous candle.
📈 Price Action & Technical Analysis
EMA 8 (thin cyan): ~6733 – Above price. Negative Slope.
EMA 21 (med cyan): ~6775 – Above price and EMA 8. Negative Slope. Rotation zone created on 1H and lower TF (EMA 8 crossed EMA 21). Crossover has not happened on higher TF's at time of post.
EMA 50 (thick cyan): ~6765 – Above current price; Flattening out.
Structure: Bullish Trending since April lows.
📈 RSI (14 Close) Current: 43 (57 MA)
Interpretation: Below neutral (50), momentum is weakening.
📈 MACD (12, 26, 9) MACD Line: 1; Signal Line: 4.2; Histogram: -3.2
Interpretation: MACD is growing bearish, histogram showing increasing intensity, yet still above 0.
🎯 Key Levels
Support: various possible trend lines shown (Purple). Price action Monday will determine their validity. Swing low at 6681.
Resistance: Overhead moving averages. ATH at 6800.
🧨 Volatility Outlook
VIX - After a decline, showing signs of inflection. Currently trending upwards on the daily TF.
Government shutdown and headline risk are of some concern to short term price action.
Short Term: A sudden opening of the government could certainly cause a bullish event. I could also imagine certain headlines that would cause a short term bearish event.
Longer term: govt shut downs have typically preceded bullish gains.
📈Macro/Fundamental Analysis
Interpretation: We are in between earnings seasons and with a Gov shutdown, void of Gov Data.
DXY - Pulled back significantly this year. I personally expect it to continue. This could provide a tail wind to equities pricing.
📆 Economic Calendar / Earnings Schedule
Econ Calendar: Relatively Light Next Week
Wednesday - 3PM EST - FOMC Minutes. Dot Plot could cause some action as the minutes are dissected.
Friday - 10AM - Michigan Consumer Sentiment Report. A big miss (up or down) could cause some action.
🔍 Summary
🔻 Trend: Long bull run - might be getting stale; Might just be getting started. You decide.
🧩 Momentum: Very high on longer TFs, Turning down on the lower.
🧠 Tactics:
Short Term - I love a 'rotation zone trade'. If price bounces back up into the EMA 21/8 spread zone, I would be looking for some day trade shorts.
Give me a THUMBS UP / COMMENTS / FOLLOW ME!
-Will
-Will
Haftungsausschluss
Die Informationen und Veröffentlichungen sind nicht als Finanz-, Anlage-, Handels- oder andere Arten von Ratschlägen oder Empfehlungen gedacht, die von TradingView bereitgestellt oder gebilligt werden, und stellen diese nicht dar. Lesen Sie mehr in den Nutzungsbedingungen.