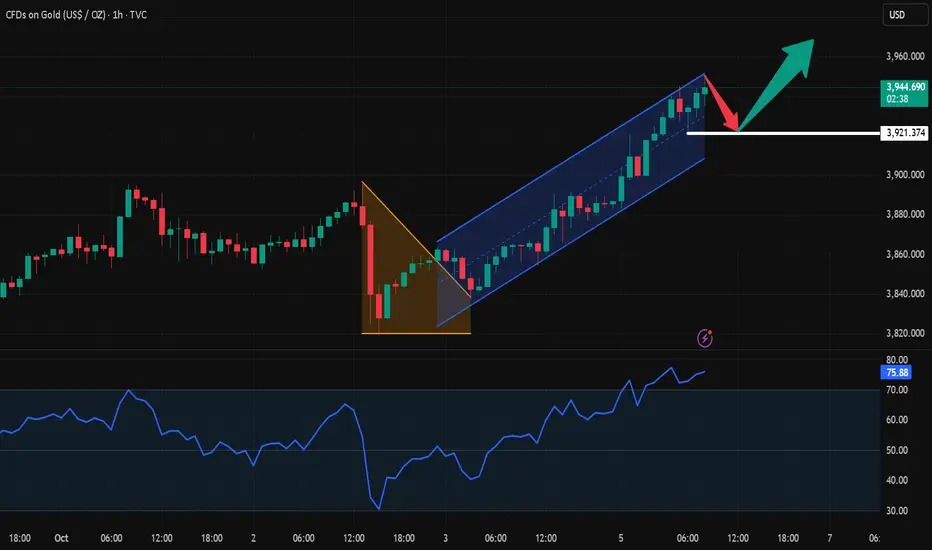
Gold has been rising for several consecutive weeks, breaking through the upper Bollinger Band on the weekly chart, and the RSI has reached the overbought zone, suggesting further upward movement. Friday saw a small bullish close, and today's Asian session saw further gains. The daily RSI has again reached the overbought zone, and the 4-hour chart is above the upward trend line, breaking through the ascending triangle.
Trade Recommendation: BUY: 3920 Target: 3940 3950
Trade Recommendation: BUY: 3920 Target: 3940 3950
The road to success is not crowded. As long as you choose the right direction and follow the right team, you will be able to move forward.
t.me/david_456654
t.me/david_456654
Verbundene Veröffentlichungen
Haftungsausschluss
Die Informationen und Veröffentlichungen sind nicht als Finanz-, Anlage-, Handels- oder andere Arten von Ratschlägen oder Empfehlungen gedacht, die von TradingView bereitgestellt oder gebilligt werden, und stellen diese nicht dar. Lesen Sie mehr in den Nutzungsbedingungen.