Adobe’s stock is entering a critical structural phase — the completion of its third global impulse and the start of the fourth corrective wave.
While the long-term uptrend remains intact, the price structure and fundamentals suggest that the most explosive growth period may already be behind us.
🧭 Long-Term Technical Context
Looking back to the early 2000s, Adobe has moved through a textbook Elliott Wave structure.
The first and second waves built the base, while the third wave delivered the explosive rally — from roughly $30 to $600, marking a 20x increase.
Now, the fourth subwave of the third major wave appears to be forming — a phase typically characterized by sideways consolidation and distribution by institutional players.
🔺 Wave 4 Triangle Formation
In many long-term wave structures, the fourth wave forms a triangle (ABCDE pattern) — a contracting structure where price oscillates between defined boundaries.
We can already observe the emerging shape:
Once the triangle ends, a final Wave 5 push could occur — potentially extending toward $700, or in an extended scenario, even $2000.
📊 Trading Range and Short-Term Strategy
At this stage, smart money tends to distribute positions gradually.
The price is oscillating within a broad corridor, providing opportunities for range-based trading:
For swing traders, this range offers multiple short-term opportunities before the next major move begins.
💵 Fundamental Context

Despite being in a late-wave structure, Adobe’s fundamentals remain strong.
These metrics suggest that even in a market downturn, Adobe’s downside risk may be more limited compared to weaker tech peers.
🧮 Fundamental Summary
✅ Consistent buybacks supporting EPS
✅ Double-digit annual revenue growth
✅ Attractive valuation relative to growth metrics
✅ Strong defensive profile versus the broader tech sector
There are no visible signs of fundamental weakness — only technical consolidation after years of exponential expansion.
⚠️ Alternative Scenario
If the stock breaks below $270, the current wave structure may need adjustment.
Such a move could imply a larger triangle or a flat correction, but the broader interpretation — that we’re inside a long-term Wave 4 — would remain valid.
📈 Market Outlook
Adobe is transitioning from a high-momentum growth phase into a strategic accumulation and distribution phase.
The stock is unlikely to replicate its earlier explosive rally, but it continues to offer structured trading opportunities inside a stable technical range.
For long-term investors, the risk-reward remains balanced, supported by solid fundamentals.
For traders, the triangle provides a clear framework: buy near lows, take profits near highs, and wait for the fifth wave breakout.
🧩 Summary
Adobe is no longer in its most explosive phase — but it’s far from weak.
This is a mature consolidation period, not a decline story.
For disciplined traders, the triangle may offer some of the cleanest swing setups in the tech sector.
📹 Full video analysis on my YouTube channel — check it out for detailed charts and Elliott Wave breakdowns!
While the long-term uptrend remains intact, the price structure and fundamentals suggest that the most explosive growth period may already be behind us.
🧭 Long-Term Technical Context
Looking back to the early 2000s, Adobe has moved through a textbook Elliott Wave structure.
The first and second waves built the base, while the third wave delivered the explosive rally — from roughly $30 to $600, marking a 20x increase.
Now, the fourth subwave of the third major wave appears to be forming — a phase typically characterized by sideways consolidation and distribution by institutional players.
🔺 Wave 4 Triangle Formation
In many long-term wave structures, the fourth wave forms a triangle (ABCDE pattern) — a contracting structure where price oscillates between defined boundaries.
We can already observe the emerging shape:
- Wave A and B are complete
- Wave C is in progress
- Wave D and E will likely complete the pattern before the final breakout
Once the triangle ends, a final Wave 5 push could occur — potentially extending toward $700, or in an extended scenario, even $2000.
📊 Trading Range and Short-Term Strategy
At this stage, smart money tends to distribute positions gradually.
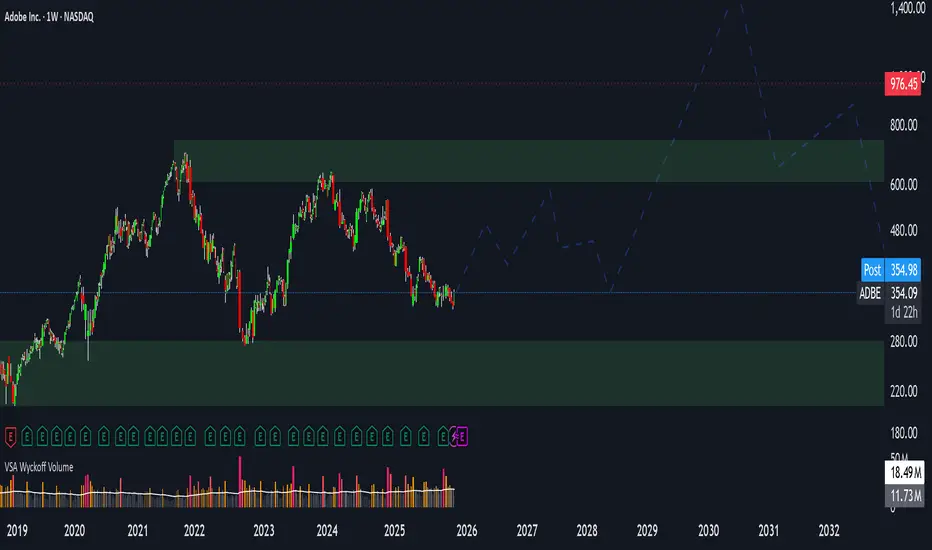
The price is oscillating within a broad corridor, providing opportunities for range-based trading:
- Buy zones: near the triangle lows (Wave A area around $350)
- Profit zones: near the triangle highs (Wave B area around $600)
For swing traders, this range offers multiple short-term opportunities before the next major move begins.
💵 Fundamental Context
Despite being in a late-wave structure, Adobe’s fundamentals remain strong.
- Share buybacks: The company continues to repurchase its own shares, supporting EPS growth.
- EPS trend: Rising steadily year over year.
- Revenue growth: Stable, around +10% YoY, with quarterly metrics showing +40% growth since Q1 2024.
- Forward P/E: Approximately 28, which, by Peter Lynch’s growth-to-PE logic, still appears reasonably valued.
These metrics suggest that even in a market downturn, Adobe’s downside risk may be more limited compared to weaker tech peers.
🧮 Fundamental Summary
✅ Consistent buybacks supporting EPS
✅ Double-digit annual revenue growth
✅ Attractive valuation relative to growth metrics
✅ Strong defensive profile versus the broader tech sector
There are no visible signs of fundamental weakness — only technical consolidation after years of exponential expansion.
⚠️ Alternative Scenario
If the stock breaks below $270, the current wave structure may need adjustment.
Such a move could imply a larger triangle or a flat correction, but the broader interpretation — that we’re inside a long-term Wave 4 — would remain valid.
📈 Market Outlook
Adobe is transitioning from a high-momentum growth phase into a strategic accumulation and distribution phase.
The stock is unlikely to replicate its earlier explosive rally, but it continues to offer structured trading opportunities inside a stable technical range.
For long-term investors, the risk-reward remains balanced, supported by solid fundamentals.
For traders, the triangle provides a clear framework: buy near lows, take profits near highs, and wait for the fifth wave breakout.
🧩 Summary
- Price structure suggests Wave 4 triangle formation
- Trading range between $350–$600
- Fundamentals remain strong and defensive
- Forward P/E at 28 — reasonable given EPS growth
- Next major target: Wave 5 breakout toward $700–$2000
Adobe is no longer in its most explosive phase — but it’s far from weak.
This is a mature consolidation period, not a decline story.
For disciplined traders, the triangle may offer some of the cleanest swing setups in the tech sector.
📹 Full video analysis on my YouTube channel — check it out for detailed charts and Elliott Wave breakdowns!
📈 Weekly stock forecasts & trading insights on Tesla, NVDA, SPY, AAPL and more.
🎥 Watch full analysis on YouTube → youtube.com/@sdkstockscenarios
— subscribe for updates!
🎥 Watch full analysis on YouTube → youtube.com/@sdkstockscenarios
— subscribe for updates!
Verbundene Veröffentlichungen
Haftungsausschluss
Die Informationen und Veröffentlichungen sind nicht als Finanz-, Anlage-, Handels- oder andere Arten von Ratschlägen oder Empfehlungen gedacht, die von TradingView bereitgestellt oder gebilligt werden, und stellen diese nicht dar. Lesen Sie mehr in den Nutzungsbedingungen.