Cardano (ADA) is a decentralized public blockchain and cryptocurrency project, built on a proof-of-stake consensus algorithm called Ouroboros. Since its all-time high of around $3 in 2021, ADA has experienced a significant downtrend, reaching lows of about 24 cents. The combination of a declining asset and declining Bitcoin (BTC) creates an ideal environment for a potential reversal. I will examine the possibilities of a Cardano recovery within the next few weeks, using technical analysis tools such as support and resistance levels, Fibonacci retracements, and Elliott Wave Theory.
Key Levels and Fibonacci Retracement
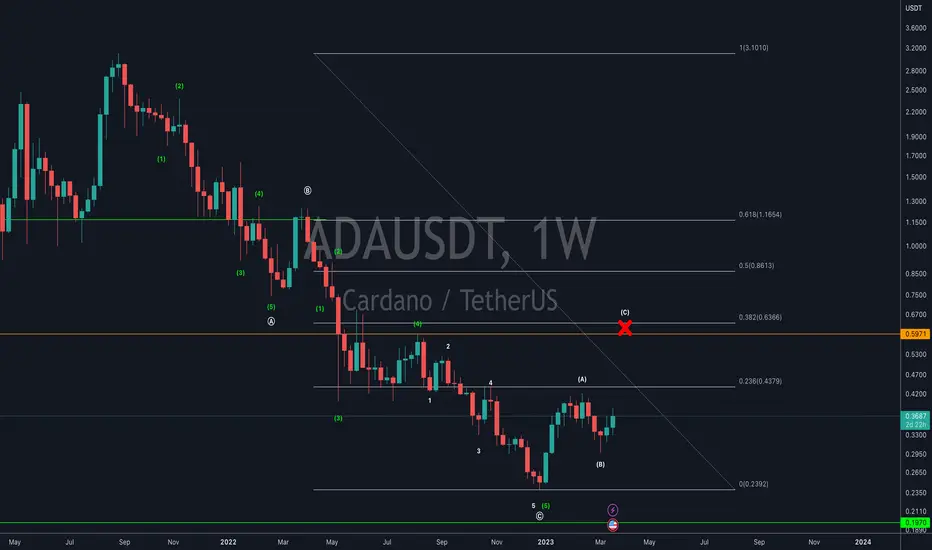
Analyzing historical price data reveals key support and resistance levels that can provide insights into Cardano's potential price movements. The 23.6% and 38.2% Fibonacci retracement levels are noteworthy in this context. While the $1.16 level is a significant resistance point, it is unlikely to be reached this year.
The current target for an exit point in Cardano is around 60 cents. Although reaching the $1 mark is possible within 2023, it is more likely to occur towards the end of the year, if at all. It is essential to evaluate the market one day at a time and keep a close eye on Bitcoin dominance. If Bitcoin dominance drops significantly, this could create the perfect storm for altcoins like Cardano.
Bitcoin Dominance Support
The support level for Bitcoin dominance currently stands at around 40%. If Bitcoin dominance begins to fall to this level or break below, it could signal an opportune moment to stay invested in altcoins such as Cardano, and potentially delay selling until Bitcoin dominance finds support again. This shift in dominance could lead to substantial gains for Cardano and other altcoins.
Elliott Wave Theory Perspective
From an Elliott Wave Theory standpoint, Cardano's price movement appears to be corrective so far. To confirm an ongoing bullish wave 3, ADA would require a significant push to the upside. Traders and investors should continue to monitor the market's behavior, especially around key dates such as the full moon on April 6th, which could potentially impact market sentiment and price action. The Elliott Wave Theory also offers valuable insights into the potential for a bullish reversal, but it remains crucial to monitor the market and adapt strategies accordingly.
Key Levels and Fibonacci Retracement
Analyzing historical price data reveals key support and resistance levels that can provide insights into Cardano's potential price movements. The 23.6% and 38.2% Fibonacci retracement levels are noteworthy in this context. While the $1.16 level is a significant resistance point, it is unlikely to be reached this year.
The current target for an exit point in Cardano is around 60 cents. Although reaching the $1 mark is possible within 2023, it is more likely to occur towards the end of the year, if at all. It is essential to evaluate the market one day at a time and keep a close eye on Bitcoin dominance. If Bitcoin dominance drops significantly, this could create the perfect storm for altcoins like Cardano.
Bitcoin Dominance Support
The support level for Bitcoin dominance currently stands at around 40%. If Bitcoin dominance begins to fall to this level or break below, it could signal an opportune moment to stay invested in altcoins such as Cardano, and potentially delay selling until Bitcoin dominance finds support again. This shift in dominance could lead to substantial gains for Cardano and other altcoins.
Elliott Wave Theory Perspective
From an Elliott Wave Theory standpoint, Cardano's price movement appears to be corrective so far. To confirm an ongoing bullish wave 3, ADA would require a significant push to the upside. Traders and investors should continue to monitor the market's behavior, especially around key dates such as the full moon on April 6th, which could potentially impact market sentiment and price action. The Elliott Wave Theory also offers valuable insights into the potential for a bullish reversal, but it remains crucial to monitor the market and adapt strategies accordingly.
CE - BitDoctor
Access our private indicators and join our Premium Room: bitdoctor.org
Beware of scams - I'll never DM you asking for funds.
Access our private indicators and join our Premium Room: bitdoctor.org
Beware of scams - I'll never DM you asking for funds.
Haftungsausschluss
Die Informationen und Veröffentlichungen sind nicht als Finanz-, Anlage-, Handels- oder andere Arten von Ratschlägen oder Empfehlungen gedacht, die von TradingView bereitgestellt oder gebilligt werden, und stellen diese nicht dar. Lesen Sie mehr in den Nutzungsbedingungen.