Update NASDAQ 09.10.2022Der NASDAQ testet sein bisheriges Jahrestief. Kurzfristig stark überverkauft und damit Chance auf leichte Erholung.
Zinserhöhungszyklus der Notenbanken noch nicht abgeschlossen.
Gewinnwarnungen der Unternehmen könnten zu weiteren Kursverlusten führen.
NAS100 Trading-Ideen


Update NASDAQ 06.10.2022Aus Verunsicherung über das künftige Zinserhöhungstempo der FED halten sich die Anleger heute zurück.
Der morgen erscheinende US - Arbeitsmarktbericht könnte Bewegung in die Märkte bringen.
Fallen die amerikanischen Indizes, fällt auch der DAX und umgekehrt.
Die entscheidende Unterstützung bzw. den Widerstand erläutere ich im Video.

Nasdaq 100: Abwärtstrend vorerst gestoppt?Wie in der letzten Analyse aufgezeigt, waren die Intermarket-Indikatoren im Juni positiv. Es gab einen steigenden Markt bis Mitte August 2022, wie erwartet. Dort ist der Nasdaq 100 bei einem Angriff auf den charttechnischen Abwärtstrend gescheitert. Zu heutigen Tage zeichnet sich der Beginn einer Charttechnischen Erholung ab. Ob diese Bewegung dann nachhaltig sein wird, ist stark zu bezweifeln. Es liegen viele Probleme in der Luft.
Folgende Kursmarken behalten wir nun sehr genau im Auge: Fällt der Nasdaq unter sein jüngstes Tief bei 10.966, dann ist dies ein weiteres deutliches Warnsignal. Ein panischer Abverkauf wäre dann jederzeit möglich. Ein Anstieg über 12.100 Punkte wäre hingegen ein positives Zeichen, weil dann höchstwahrscheinlich die Intermarket-Indikatoren auch ein Signal bringen würden.
Wir wünschen Ihnen viel Erfolg
Ihr Team der TradingBrothers

NAS 100 US - Meine MeinungSeht selber. Ist eine klare sache. und kann ja nur nach oben oder unten durchbrochen werden. Wir werden sehen ob das was wird. Schönen Feiertag!!!

CICLE LOW mit ordentlich Support.In den Märkten befinden wir uns an einem sehr spannenden Punkt. Einerseits haben wir extreme Volatilität gesehen mir starken Abverkäufen, was grundsätzlich nicht lange andauert und ein Zeichen auf Umkehr bedeutet, andererseits, beschäftigt man sich mit Kyllen, so sieht man, dass das große "Quartalszyklus" von Q3 jetzt zu Ende ist und wir ab nächster Woche in einen
neuen Zyklus kommen, welcher wiederum steigende Kurse mit sich bringen könne, in den Oktober hinein.
Andererseits, sehen wir dass das Momentum verloren geht, den Bären wird langsam langweilig und obwohl, die US Treasuries und der Dollar enorm steigen, der Markt sich nur noch schwer nach unten bewegt (Stand Montag 26.09.2022), was wieder zeigt, dass wir uns in einer Anti-zyklischen Marktphase bewegen indem der Markt erste Anzeichen auf einen nachten Schub gibt.
Der USD hat seine obere Trendlinien-Grenze erreicht und ich jetzt ebenso anfällig für Korrektur.
Wir werden sehen wie sich der Markt verhält, ich bin allerdings kurzfristig für das Q4 eher auf der Long Seite, als auf der Short Seite.
Viel Erfolg

Doch "nur" 0,75... TOP OUT bis Oktober?Eines ist klar, die FED war zu sparsam, sie haben alle Erwartungen eingehalten, eigentlich sehr positiv überraschend...
Der Markt hat das DIESMAL! bereits wirklich schon eingepreist, und die Wahrscheinlichkeit dass der USD jetzt fällt (Annahme anhand des heutiges DROPS vom USD - starker Loss = Anzeichen für Umkehr + HAMMER Kerze!)
Könnte ein technisches Signal sein, dass der Markt genau HIER, nach dem FOMC Meeting erstmal 1-2 Wochen ordentlich Long geht, wir steigende Kurse sehen und dann bis zu den CPI + Inflationsdaten im Oktober (möglicherweise plötzlich stark angestiegen)... diese steigenden Kurse haben werden, ehe der Markt dann crasht.
Doch ein Risiko bleibt - Nuklearwaffen um die Ukraine.
Sollte hier eine Bombe hochgehen, dann wird das dramatische Folgen für den Markt haben.
Viel Erfolg
Nasdaq - 200 MA auf WochenbasisIch lehne mich schonmal kurz vor der FED-Sitzung aus dem Fenster und tippe auf eine Erholung über 14.000 Punkte in den nächsten Wochen… Der 200 MA auf Wochenbasis war im Tech-Bereich schon oft eine starke Unterstützung.

Nasdaq longKorrektur abgeschlossen, Nasdaq geht wieder rauf, wir haben starke Support, beweis letzte Tages Kerze

Long im USTECHCFD Tech könnte von mir hier eingezeichneten Verlauf nehmen. Sollte relativ übersichtlich sein.

NDX Count 2 weeksNach meiner Erfahrung ist ein 2-Wochen-Chart ideal, um die mittelfristige Struktur zu erfassen.
Den Cursor einfach über das eingefügte Bild ziehen, dann verschwindet die Transparenz.
Lob an Trading View - sehr gut gemachtes Feature.

Update NASDAQ 10.09.2022NASDAQ mit Erholung im intakten Jahresabwärtsrrend 2022.
Jetzt schon Schnäppchen kaufen und bloß nichts verpassen, oder auf Short - Einstiege vorbereiten ?
Meine Einschätzung dazu in der Video Analyse.

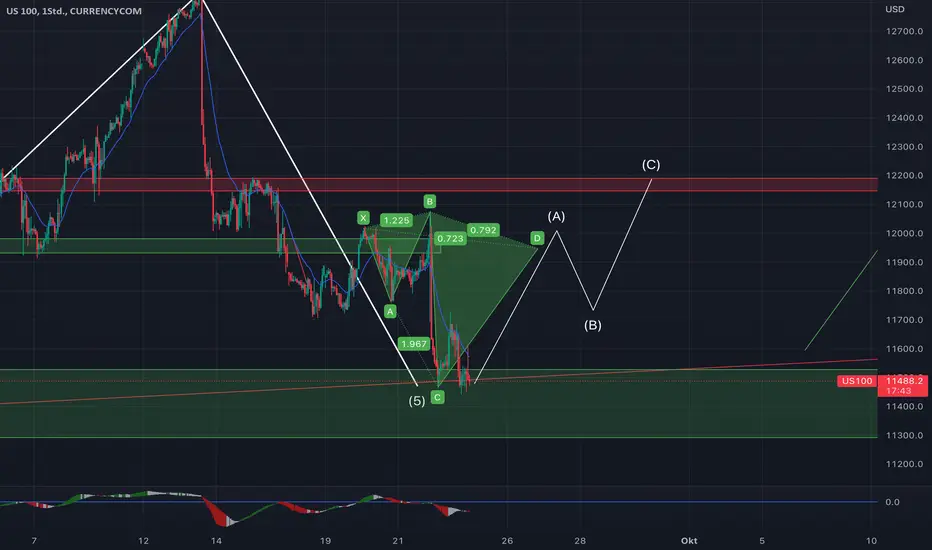
Elliot-Wellen Analys Nasdaq 100, Welle B gestartet ?Der Zeitpunkt überrascht, ich hatte den Start etwas später erwartet. Sollte die B die Welle X überschreiten, ist der Count hinfällig. Grund für den frühen Start könnte die extrem bärische Positionierung der Anleger sein, die jetzt in Schwierigkeiten kommen und kaufen müssen. ( Short-Squeeze) Trotzdem sollte man aber auch die Möglichkeit in Betracht ziehen, das die A noch nicht fertig ist, ( fehlende 5 ?) davon gehe ich aber nicht aus. Viel Glück und Erfolg.

Nasdaq 100 4h Chart = 2022 daily Chart lolNasdaq 100 4h Chart = 2022 daily Chart
Wird es sich genauso ausspielen...

UNSERE SHORT IST DA!Mit großer Verzögerung haben wir endlich unsere Abwärtsbewegung, etwas spät, aber doch.
Bereits vor einer Woche stieg der USD an und das war ein solides Zeichen für eine kommende Abwärtsbewegung.
Außerdem befand sich der VIX Indikator genau auf der untergeordneten Trendlinie (aktuell leicht unterhalb mit Signal auf Umkehr).
Diese Hinweise wurden nun in die Realität umgesetzt und die Kurse beginnen zu fallen.
Viel Erfolg.

LONG Versuch / WELLE 4Lange her, war auch etwas wenig los... jetzt tut sich aber wieder was!
Der Markt scheint Welle 3 vollendet zu haben und perfekt an der magischen 12.000er Grenze und auch dem Support Bereich, zu drehen und einmal, auch aufgrund der Abflachenden news, zu steigen.
Dieser Anstieg wird nicht lange dauern, aber er sollte uns trotzdem rasant nach oben befördern. Daher gehe ich von 1-2 Wochen Anstieg aus, bevor wir tiefer in Welle 5 fallen. (Ende September)... / ZYKLUS ENDE + Sommerloch Ende !
Viel Erfolg

Update NASDAQ CFD 04.09.2022Nasdaq bald bei 11.000 USD ?
Meine Einschätzung dazu in der Video Analyse.

US 100 Nasdaq - Longchance um die 11800 PunkteNach der letzten starken Aufwärtsbewegung und der anschließenden Korrektur stehen die Chance um die 11800 möglicherweise gut, dass wir einen Aufschwung für einige Wochen sehen mit neuem lokalen Hoch. Werde mich in der Kaufzone mit einem entsprechenden ETF eindecken.

Oben mahlen die Mühlen langsamaber sie mahlen.
Das Ratio Nasdaq zu SP500 hat ein Top gebildet, inclusive Rebound zur Neckline.
Es ist zu erwarten, dass Ungemach in erster Linie von der Nasdaq ausgehen wird.

NQ LONG MÖGLICKEITDie US-Aktienmärkte konnten sich gestern Abend bis zum Börsenschluss größtenteils erholen. Der Dow Jones machte seine früheren Verluste wett und beendete den Tag mit einem Plus. Der Index legte um 146 Punkte zu und schloss bei 31.656 Punkten. Dies verhalf dem S+P 500 zu einer ähnlichen Entwicklung, prozentual fielen die Gewinne dort jedoch geringer aus, da der Nasdaq 100 trotz seines Anstiegs keine großen Fortschritte machen konnte und den Tag kaum höher schloss. Der Index schloss nur 2,59 Punkte im Plus bei 12 274 Punkten. Zuvor war er sogar bis auf 12.012 Punkte gefallen. Dieser Rückgang führte ihn unter die bekannte technische Unterstützung bei 12.062 Punkten. Über Nacht ist der Index-Future wieder leicht zurückgefallen und rechnet derzeit mit einer leicht niedrigeren Eröffnung im Laufe des Tages. Im Laufe des Vormittags werde ich mehr dazu berichten.

Unser Playbook für diese WocheDie neue Woche beginnt mit Aktien, die am Freitag unter die Räder gekommen sind, und es ist zu erwarten, dass asiatische Aktien um 1 bis 1,5 % niedriger eröffnen werden. Powells Rede in Jackson Hole war sehr kurz und sollte eindeutig darauf hinweisen, dass dieser Fed-Ausschuss hart im Kampf gegen die Inflation bleiben wird. Die Volatilität war vor allem bei Aktien zu beobachten, und es geht mit einer Abwärtsneigung in die neue Woche - insbesondere gegenüber den EU-Aktienmärkten, wobei es im GER40 um die 12.400 interessant werden könnte.
Wichtige Termine für die kommende Woche:
Montag
Australien - Einzelhandelsumsätze im Juli (3:30 Uhr MESZ) - Der Konsens lautet, dass die Umsätze im Juli um 0,3 % gestiegen sind, trotz einer Anhebung der RBA um 50 Basispunkte und eines Rückgangs des Verbrauchervertrauens. Es müsste schon ein deutlicher Fehlschlag sein, um den Kurs für die September-Sitzung der RBA zu beeinflussen, welche eine Anhebung um 45 Basispunkte für September einpreist. Achten Sie auf das Tief von 0,6862 als mögliche Unterstützung für den AUDUSD , und die Richtung wird wahrscheinlich von den S&P500-Futures, dem chinesischen CSI300 und dem USDCNH bestimmt werden.
Dienstag
Deutschland - Aug CPI (14:00 MESZ) - Der Markt erwartet einen Anstieg des Preisdrucks um 0,3% MoM bzw. 7,8% YoY ( von 7,5%) - Da Reuters berichtet, dass die EZB am 8. September eine Zinserhöhung um 75 Basispunkte anstrebt (der Markt rechnet derzeit mit 63 Basispunkten), wird der EUR empfindlich auf diesen Druck reagieren. Aus taktischer Sicht könnte sich der EURUSD in dieser Woche in einer Spanne von 1,0090 bis 0,9850, bewegen. Auch möglich wäre eine leichte Long-Positionierung beim EURGBP .
USA - Die stellvertretende Fed-Vorsitzende Brainard spricht (20:15 Uhr MESZ) auf einem FedNow-Workshop - Brainard tendiert in der Regel eher zur dovishen Seite, aber angesichts der entschlossenen und prägnanten Rede von Powell in Jackson Hole könnte man annehmen, dass ihre Ansichten denen von Powell ähneln werden. Der Markt sollte eine Angleichung zwischen Powell und Brainard erwarten, so dass mit Volatilität zu rechnen ist, wenn dies nicht der Fall sein sollte.
Mittwoch
China - PMI für das verarbeitende Gewerbe und den Dienstleistungssektor (3:30 Uhr MESZ) - das Ergebnis könnte sich auf USDCNH , Kupfer, CN50 und den AUD auswirken, wenn es schlechter ausfällt als erwartet. Der Markt erwartet erneut einen schwachen Wert für das verarbeitende Gewerbe von 49,3 ( von 49,0), während der PMI für den Dienstleistungssektor mit 52,2 (53,8) erwartet wird. Der chinesische Aktienmarkt konsolidiert auf Tagesbasis weiter und ist schwierig zu lesen. Der USDCNH drohte in der vergangenen Woche zu kippen, hat sich aber wieder gefangen und ist am Freitag gestiegen - ein wichtiges FX-Paar in der kommenden Woche, da es einen Durchbruch der 6,9000er-Marke geben könnte, der andere USD-Paare zum Kauf anregen würde.
Europa - Schätzung des Verbraucherpreisindex für August (11:00 Uhr MESZ) - der Markt erwartet eine Gesamtinflation von 9 % ( von 8,9 %), die Kerninflation wird bei 4,1 % (4 %) erwartet. Ein Wert von über 9,3 % würde den Markt in Schwung bringen, auch wenn es gilt weiterhin die deutschen Strompreise zu beobachten, die letzte Woche um 40 % gestiegen sind. Der EU-Nat-Gas-Preis liegt bei 306 € und damit um 18 % höher als in der Vorwoche, und wenn sich dieser Anstieg fortsetzt, wird der EUR auf Käufer stoßen. Es sieht so aus, als ob der GER40 mit Blick auf das Schicksal von NS1 auf einen Abwärtstest von 12.400 zusteuern könnte. Wie oben beschrieben, ist heute ein wichtiger Tag für die EZB , an dem Holzman, Stournaras, Wunsch und Muller ab 11:00 Uhr sprechen werden.
Kanada - Q2 BIP (14:30 MESZ) - der Markt erwartet ein Wachstum von 0,1% QoQ, 4,9% YoY - BIP-Zahlen als Volatilitätstreiber können trügerisch sein, jedoch gibt es einige fundamentale Unterstützungsfaktoren für den CAD, der immer noch relativ attraktiv aussieht. Die nächste BoC-Sitzung findet am 7. September statt , und der Markt rechnet mit einem Kurs von 68 Basispunkten für eine Anhebung, so dass die Tendenz in Richtung einer Anhebung um 75 Basispunkte geht.
USA - CB-Verbrauchervertrauen (16:00 MESZ) & JOLTS-Bericht. Es wird erwartet, dass das Verbrauchervertrauen von 95,7 auf 97,7 steigt, was die Kurse von Vermögenswerten unterstützen könnte. Der JOLTS-Bericht könnte sich jedoch als der größere Einfluss erweisen - der Markt erwartet 10,47 Mio . offene Stellen, ein Rückgang gegenüber den 10,69 Mio . im Juni - die Aktienmärkte erholen sich, wenn sie eine niedrigere Zahl an offenen Stellen erhalten, da die Fed einen weicheren/langsameren US-Arbeitsmarkt wünscht. Es sei daran erinnert, dass der Arbeitsmarkt mit 1,9 offenen Stellen für jeden Arbeitssuchenden immer noch zu heiß ist, um den Fuß vom Gaspedal zu nehmen.
Donnerstag
Australien - Q2 private Investitionsausgaben (03:30 MESZ) - vor dem Q2-BIP (veröffentlicht am 7. September) erhält der Markt die Teilergebnisse - der Markt erwartet einen Anstieg der privaten Investitionsausgaben um 1% - das Ergebnis müsste eine große Über- bzw. Unterschreitung sein, um den AUD zu erschüttern, könnte aber für einige Schlagzeilen sorgen.
USA - ISM Manufacturing (16:00 Uhr MESZ) - das Risikoereignis, das nach dem Rückgang des S&P-Berichts über das verarbeitende Gewerbe in den USA auf 51,3 Punkte in der vergangenen Woche in den Mittelpunkt rückt. Der Markt rechnet mit einem Wert von 52,0 ( von 52,8), und ein Wert unter 50 ist nicht auszuschließen und würde einen Rückgang ab Juli signalisieren, was mit ziemlicher Sicherheit zu einem Umschwung bei riskanten Anlagen führen würde. Ein Wert über 52 könnte den USD stützen.
Freitag
USA - Non-Farm-Payrolls (14:30 MESZ) - der Höhepunkt der Woche und zusammen mit dem Verbraucherpreisindex für August (veröffentlicht am 13. September) sollte er den Kurs einer Anhebung um 50 oder 75 Basispunkte durch die Fed am 21. September beeinflussen. Der Markt erwartet eine Arbeitslosenquote von 3,5 % und 300 000 neu geschaffene Arbeitsplätze (die Schätzungen der Ökonomen reichen von 452 000 bis 75 000). Die durchschnittlichen Stundenlöhne werden bei 5,2 % erwartet. Dies sind kaum "weiche" Erwartungen, und wenn diese Zahlen nach Powells Rede stimmen, dürften die Erwartungen auf über 70 Basispunkte steigen und eine Handvoll Ökonomen ihre Forderung für September auf 75 Basispunkte ( von 50 Basispunkten) revidieren - dies wäre sowohl positiv als auch negativ für den NAS100 . Die Aktienbullen bräuchten wirklich ein schwaches Ergebnis unter 100k Arbeitsplätzen, um sich zu erholen.

Wann kommt der große Crash?Die Ruhe vor dem Sturm?
Wie in meiner letzten Analyse bereits erwähnt gehe ich weiterhin von einem großen Crash aus, die Euphorie am Markt hat keinerlei fundamentale Unterstützung und wir haben noch immer eine stagnierende Wirtschaft, hohe Inflation und zu niedrige Zinsen.
Der Markt wurde durch die earnings ordentlich getäuscht und es sollte nicht lange dauern bis die Realität, die Tatsachen wieder auf den Boden bringt.

