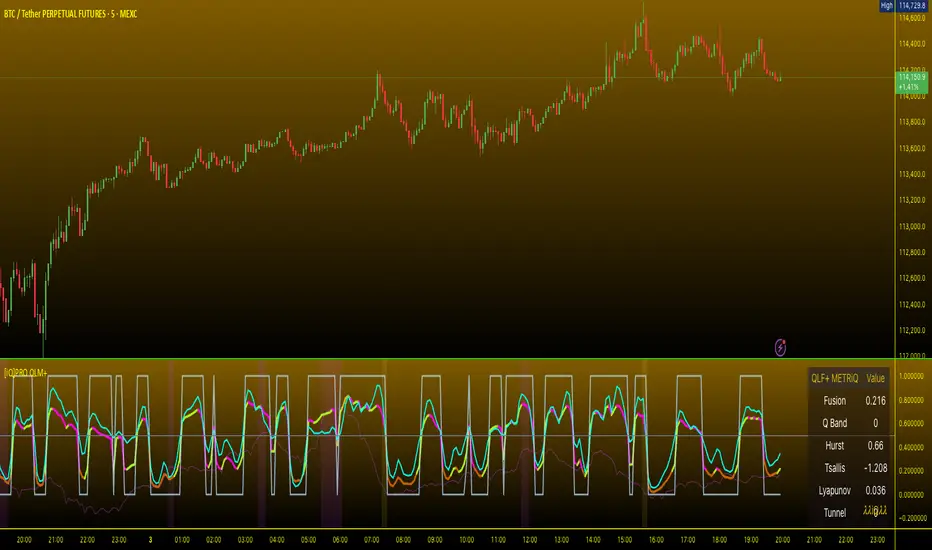
[iQ]PRO Quantum LagMan+ PRO Quantum LagMan+ (QLM+) — A Fusion Oscillator for Regime-Aware Entries
Overview
PRO Quantum LagMan+ is a next‑generation oscillator built for precision timing in dynamic markets. It blends advanced signal processing (multi-mode Laguerre smoothing) with physics-inspired analytics (Tsallis entropy, Hurst exponent, Lyapunov dynamics, and a tunneling probability model) to create a single fusion signal designed to adapt across regimes. The result is an actionable, regime-aware oscillator with adaptive thresholds, quantum energy band context, volatility gating, and optional trend filtering—complete with alerts, signal markers, and an information panel.
What it does
Normalizes momentum: Converts a Laguerre-based oscillator to a stable 0–1 scale for clear, cross-market comparability.
Maps “quantum” states: Assigns the oscillator to discrete energy bands to estimate state transitions and momentum intensity.
Fuses chaos and structure: Blends oscillator intensity, quantum momentum, and measured complexity/entropy into a single fusion line.
Filters by regime: Volatility and trend filters aim to suppress low-quality signals in quiet or unfavorable conditions.
Generates clean signals: Adaptive long/short thresholds with cooldown logic and coherence checks to reduce noise.
Explains itself: An info table displays fusion value, band index, entropy and chaos metrics, tunneling probability, and filter status.
Core components
Laguerre Multi-Mode Engine
Function: and1lag computes an ultimate smoother (ult), optional blended Laguerre filters, and a robust z-scored oscillator.
Control: period, lag, lagmode , RMSP add flexibility across timeframes and instruments.
Quantum Engine
Quantum Energy Levels: Discrete “bands” derived from normalized oscillator statistics.
Quantum Momentum: A 0–1 measure based on the current band position to capture intensity of state.
Coherence: Proximity between the oscillator and its active band (higher coherence = higher confidence).
Tunneling Probability: A barrier-like model that estimates the probability of a transition through local resistance/support structure.
Advanced Physics Layer (optional, heavy CPU)
Tsallis Entropy: A generalized entropy measure; elevated values can correspond to more complex or uncertain dynamics.
Lyapunov Exponent: A proxy for local sensitivity to initial conditions; higher values suggest chaotic/unstable behavior.
Hurst Exponent: A measure of persistence vs. mean reversion (H > 0.5 persistent, H < 0.5 mean-reverting).
These terms are summarized for trader context; the script uses bounded, practical implementations tuned for charting.
Fusion Oscillator
Composition: 50% normalized oscillator + 25% quantum momentum + 25% chaos/entropy blend.
Range: Constrained to for intuitive thresholds and consistent interpretation.
Regime Filters and Signals
Trend Filter: trendEMA with configurable trendLen to align signals with primary direction.
Volatility Filter: ATR-based gating with atrMultMin/atrMultMax bands, focusing on tradable volatility.
Adaptive Thresholds: Dynamic long/short thresholds scale with observed volatility.
Cooldown: signalCooldownBars limits rapid-fire signals to reduce whipsaw.
Alerts: Built-in alertcondition for automated notifications.
Visuals and UI
Main plots:
Fusion (thick, color-changing by state)
Norm Laguerre Osc (baseline momentum)
Quantum Momentum (band-based intensity)
Chaos Resonance (entropy/chaos contribution)
Bands and zones:
Quantum band visualization for context
Entropy zones via background shading (high/low extremes)
Info Table (showInfoTable):
Fusion, Quantum Band index, Hurst, Tsallis, Lyapunov, Tunneling Probability, Coherence, Volatility OK
Signal Markers:
Long: triangle up at bottoms
Short: triangle down at tops
Suggested usage
Entries:
Long bias when Fusion rises from low zones toward midline with high coherence, tunnel probability above threshold, trend filter positive, and volatility OK.
Short bias when Fusion falls from high zones with similar filter alignment and coherence.
Exits:
Consider scaling out near extremes (Fusion > 0.8 or < 0.2), during entropy spikes, or when coherence weakens.
Regime awareness:
Adjust trendLen for your timeframe.
Tighten atrMultMin to avoid low-vol chop.
Use adaptiveThresholds for cross-asset consistency.
Key inputs
Quantum Core: quantumLevels, planckConst, massDensity, tunnelThreshold
Advanced Physics: enableAdvanced, tsallisQ, lyapunovDim, entropyLength
Filters: useTrendFilter, trendLen, useVolFilter, atrLen, atrMultMin, atrMultMax
Signals: adaptiveThresholds, signalCooldownBars, showSignals
Display: showQuantumBands, showComponents, showEntropyZones, showInfoTable
Lag Options: source, period, lag, lagmode, RMSP
One glance clarity: A single Fusion line encapsulates momentum, state, and complexity.
Regime-adaptive: Thresholds and filters tune to volatility and trend.
Signal discipline: Coherence and cooldown aim to reduce false triggers.
Transparent context: The info table tells you why a signal is firing, not just that it is.
Notes and best practices
Multi-timeframe confirmation is recommended for higher-conviction entries.
The Advanced Physics layer can be CPU heavy; disable it for lightweight scanning or enable for precision.
Optimize inputs per asset class and timeframe (crypto vs FX vs equities).
This is an analytical tool, not financial advice. Always validate with risk management.
Alerts
Hybrid QLF Long: triggers on qualified long conditions
Hybrid QLF Short: triggers on qualified short conditions
Attribution and license
Pine Script code is licensed under the Mozilla Public License 2.0.
© MarketMakerIQ
Quick start
Add to chart and enable showInfoTable to understand live readings.
Start with defaults; toggle useTrendFilter and useVolFilter to match your style.
If performance allows, enable Advanced Physics and tune tsallisQ, lyapunovDim, entropyLength.
Set alerts on the included conditions and forward-test across sessions.
Statistics
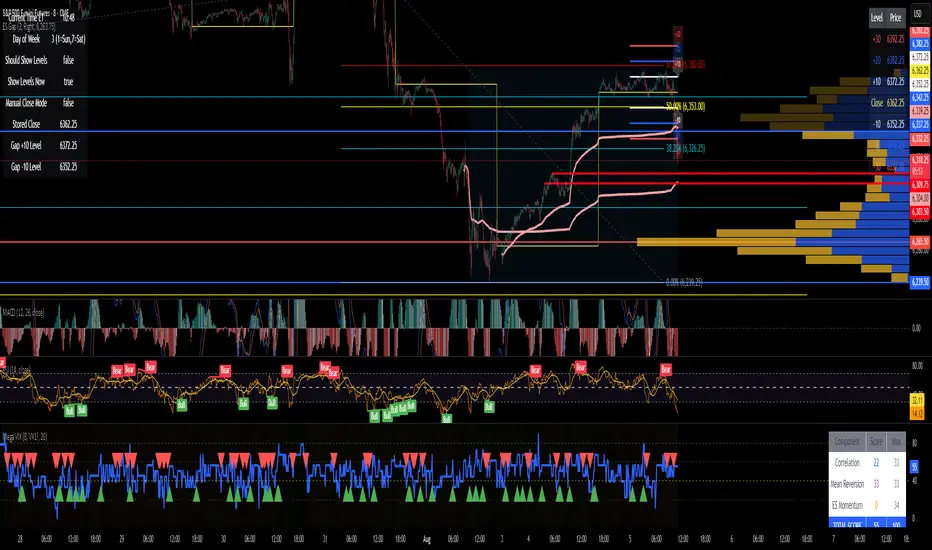
ES Gap Trading LevelsImproved closing time handling so that the gap is based on the last bar to capture the 3:59:59 closing price.
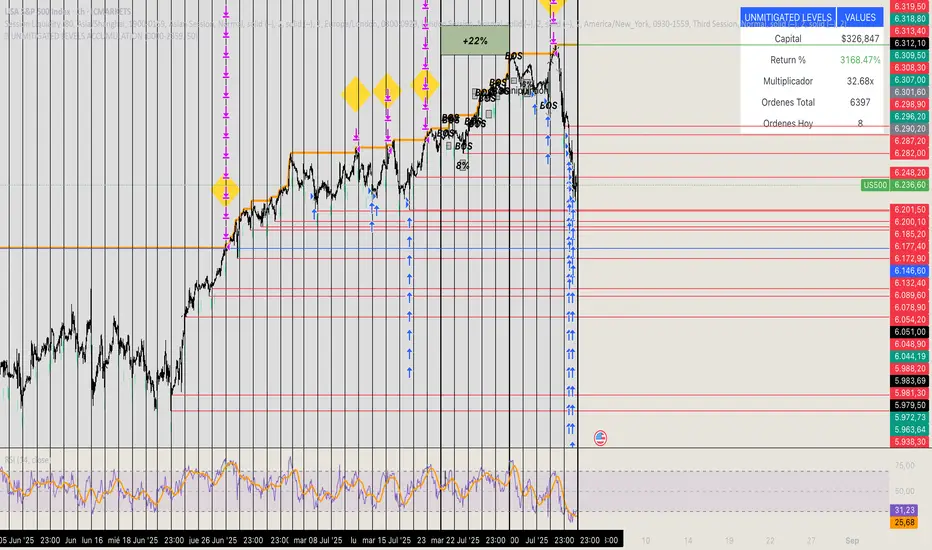
🏆 UNMITIGATED LEVELS ACCUMULATIONPDH TO ATH RISK FREE
All the PDL have a buy limit which starts at 0.1 lots which will duplicate at the same time the capital incresases. All of the buy limits have TP in ATH for max reward.
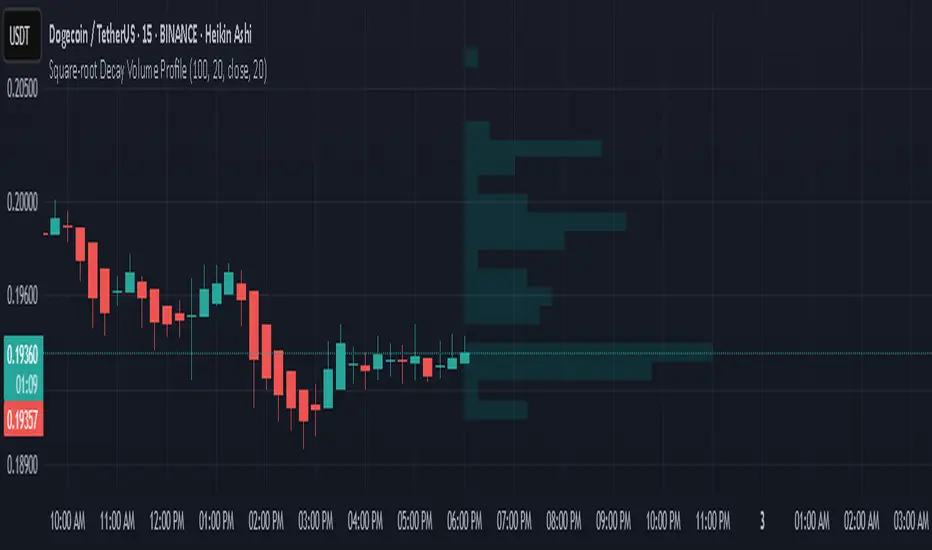
Square-root Decay Volume ProfileThis indicator displays a custom price profile that mimics a volume profile using occurrence-based weighting rather than actual volume. It counts how often the selected price source (e.g., close) falls within each price bin over a lookback period. What makes it unique is the use of square-root time decay: more recent price occurrences are given greater importance, while older data is discounted proportionally to the inverse square root of its age.
Each bin's relative weight is visualized as a horizontal bar aligned to the right edge of the chart, showing where price has "spent time" more recently. This allows traders to identify areas of interest, balance zones, and potential support/resistance levels based on decayed price density.
Key Features:
Square-root decay weighting favors recent price action
Adjustable lookback period, bin count, and histogram width
Works with any price source (close, hl2, etc.)
Plots boxes directly on the chart for clear visualization
This tool is especially useful for discretionary traders seeking a price-centric alternative to traditional volume profiles, with an added emphasis on recency.
safa bot alertGood trading for everying and stuff that very gfood and stuff please let me puibisjertpa 9uihthsi fuckitgn code

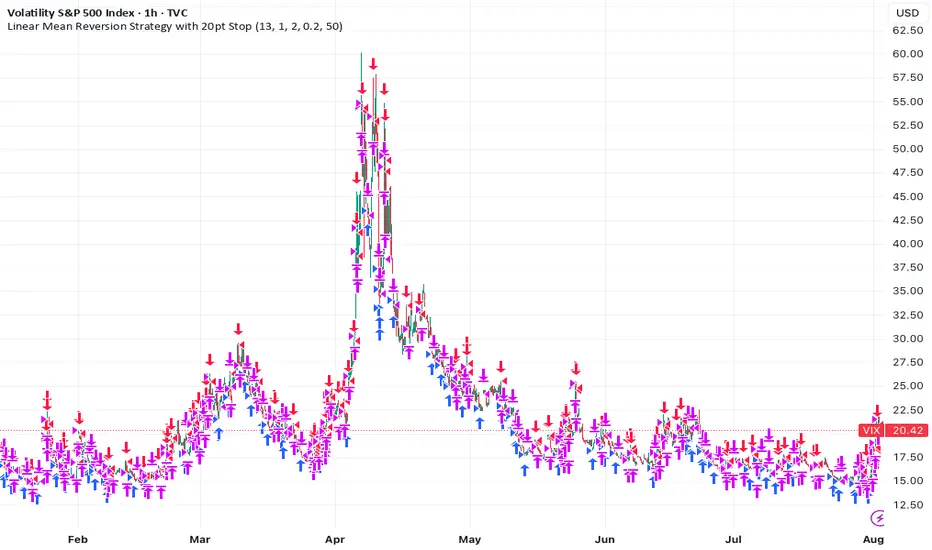
Linear Mean Reversion Strategy📘 Strategy Introduction: Linear Mean Reversion with Fixed Stop
This strategy implements a simple yet powerful mean reversion model that assumes price tends to oscillate around a dynamic average over time. It identifies statistically significant deviations from the moving average using a z-score, and enters trades expecting a return to the mean.
🧠 Core Logic:
A z-score is calculated by comparing the current price to its moving average, normalized by standard deviation, over a user-defined half-life window.
Trades are entered when the z-score crosses a threshold (e.g., ±1), signaling overbought or oversold conditions.
The strategy exits positions either when price reverts back near the mean (z-score close to 0), or if a fixed stop loss of 100 points is hit, whichever comes first.
⚙️ Key Features:
Dynamic mean and volatility estimation using moving average and standard deviation
Configurable z-score thresholds for entry and exit
Position size scaling based on z-score magnitude
Fixed stop loss to control risk and avoid prolonged drawdowns
🧪 Use Case:
Ideal for range-bound markets or assets that exhibit stationary behavior around a mean, this strategy is especially useful on assets with mean-reverting characteristics like currency pairs, ETFs, or large-cap stocks. It is best suited for traders looking for short-term reversions rather than long-term trends.
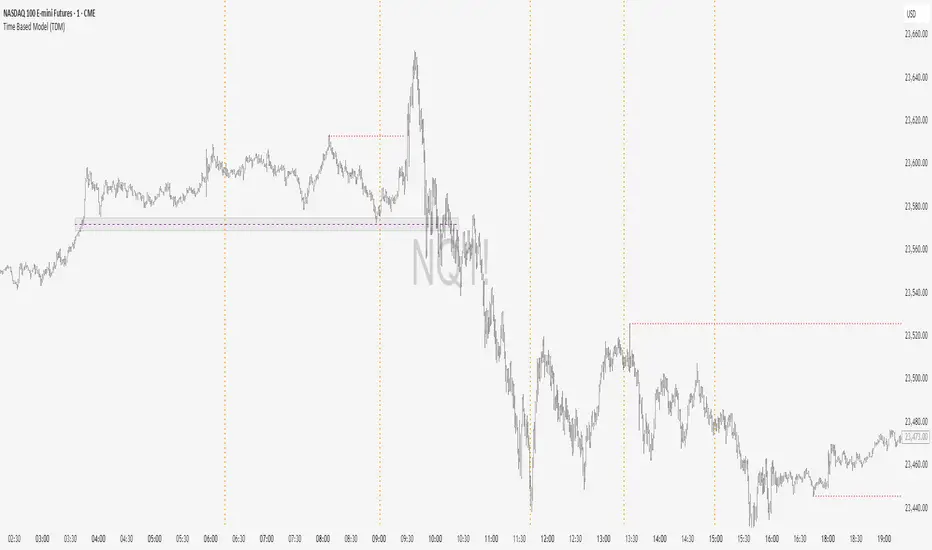
Time Based Model (TDM)This indicator is based on TDM's Time-Based Model, designed primarily for trading indices during the New York session.
The Time-Based Model follows the DC framework with some key adjustments:
It focuses on the New York session time, specifically from 14:00 to 14:00 EST.
The model pulls time Fibonacci levels between these 14:00-to-14:00 periods to identify potential market turning points.
Additionally, it applies the time Fibonacci retracement again on the last two segments to refine timing analysis.
This approach helps traders anticipate when price action is more likely to react, based on time cycles rather than just price levels, improving timing precision within the NY session.
Chaos Theory : Expansion Analysis Uncovering Probable Price PathWhat is Chaos Theory?
Chaos theory is the study of complex systems that appear random but actually follow deterministic mathematical laws. Discovered by meteorologist Edward Lorenz in the 1960s, it revealed that seemingly chaotic behavior often hides precise mathematical patterns.
Key Concepts:
The Butterfly Effect
The famous principle that tiny changes in initial conditions can lead to vastly different outcomes. In markets, this means a small price movement at a critical juncture can cascade into major trend changes. Named after Lorenz's discovery that a butterfly flapping its wings in Brazil could theoretically cause a tornado in Texas.
Sensitive Dependence on Initial Conditions
Chaotic systems are extremely sensitive to their starting state. While we cannot predict exact long-term outcomes, we can identify probability zones where the system is likely to evolve. This is why weather forecasts work for days, not months - and why our indicator predicts price destinations, not timing.
Strange Attractors
In chaos theory, systems tend to evolve toward certain states called attractors. Price doesn't move randomly - it's drawn toward these mathematical attractors that we identify as probability zones.
Fractals and Self-Similarity
Chaotic systems display similar patterns at different scales. This is why price charts look similar whether viewing 1-minute or daily timeframes - the same mathematical forces operate across all time scales.
Deterministic Chaos
The paradox at the heart of chaos theory: systems that are completely deterministic (following precise mathematical rules) can produce behavior that appears random. Markets aren't random - they're chaotic, which means they're predictable within probability bounds.
Why This Matters for Trading
Traditional technical analysis assumes markets are either random (efficient market hypothesis) or follow simple patterns (support/resistance). Chaos theory reveals a third truth: markets are complex dynamical systems that follow mathematical laws we can model and predict - not with certainty, but with probability.
This is the foundation of our indicator: applying the same mathematics that predicts weather patterns and planetary orbits to identify where price is mathematically likely to travel next.
🌟 Welcome to the World of Chaos Theory
We hope to provide our clients with a program that will define future points to which we believe price will expand to, based on a given probability % of one event occurring rather than another. In this case, the other event = price not expanding to our predicted area and reaching an invalidation state. This entire theory and the work done assumes that price behaves like a complex dynamical system that is highly sensitive to initial conditions.
🔮 Predictive vs. Reactive Systems
Pay special attention to the language used. Our belief is that we can provide you a tool that is predictive, not reactive - the latter of which falls into the class of descriptive systems. Although the term of price action study is referred to as time-series forecasting, most if not all of the works done under this umbrella do not forecast anything. They only describe the current or recent past state of affairs using averages, volume, volatility, and other concepts.
📊 Understanding Probability-Based Prediction
A predictive system conjured from the world of chaos theory is not a final solution to the mystery of price. In reality, we only can give you probabilities of where price may end up - this would be a point in space, not time, which we believe would be more likely than another, depending on the analysis of the initial conditions.
To make the point of the last paragraph crystal clear: while we can tell you, with respect to the probabilities, where price will end up in terms of a price point, we don't know WHEN. That is another part of the mystery that perhaps only clairvoyance can hope to uncover.
📈 Performance Statistics
For the question of what the probabilities are, meaning the success of the follow through of price, the answer is given in a stats panel, which measures the success of promises made by the indicator - that price would reach a certain point before being invalidated by moving too far in the opposing direction. It's not helpful to advertise or make false claims, therefore one should take advantage that we offer a free version, and using a pre-defined lookback window, confirm the probability calculations and determine the follow through rate with respect to the specific symbol and timeframe that the user decides to use.
⚠️ What This Is Not
What this is not → Descriptive. We have zero interest in describing what price is doing. In fact, the entire industry of price forecasting is dedicated to this task, therefore you can rest assured that any coincidence with an RSI or any type of moving average etc. is simply that - coincidence. We do not use any known pre-made indicators or formulas.
It has been our belief that price has an underlying mathematical pattern that can be predicted within probability bounds. If you read that carefully, we are predicting the pattern, not looking to find and describe some sort of underlying structure.
🧩 Understanding Market Complexity
It should be understood that price is a complex system, even if our initial assessment of the conditions are correct. We have to remember that price is a fractal structure - there are always different initial conditions clashing, as well as forming. This is without taking into account the manipulation of the system, as well as external intervention in the natural progression of the system by news or other significant events.
---
📋 To Summarize:
🔬 1. Chaos Theory Application to Markets
- Novel Concept: Treating price as a chaotic particle rather than random movement
- What This Means: Chaotic systems have underlying mathematical patterns that can be predicted within probability bounds
- Your Benefit: Access to predictive mathematics previously used only in physics and meteorology
🧮 2. Complex Systems Mathematics
- Novel Concept: Applying non-linear dynamical systems theory to financial markets
- What This Means: Markets behave like complex adaptive systems with emergent properties
- Your Benefit: Understanding market behavior at a fundamental mathematical level
🎯 3. Probability Field Mapping
- Novel Concept: Creating mathematical probability fields for future price locations
- What This Means: Each zone represents a calculated probability destination, not arbitrary support/resistance
- Your Benefit: Trade toward mathematically-derived targets instead of guessing
---
💡 Why This is Fundamentally Different from All Other Indicators
📉 Traditional Indicators:
- Use historical price data to create lagging signals
- Based on statistical averages and linear mathematics
- Assume markets are random or follow simple patterns
- React to what already happened
🚀 This Chaos Theory Approach:
- Uses mathematical modeling to predict future probability zones
- Based on non-linear complex systems mathematics
- Treats markets as chaotic but predictable systems
- Proactively identifies where price is likely to go
No Curve Fitting: Unlike indicators optimized for specific timeframes or instruments, chaos theory principles are universal mathematical laws that apply consistently across all markets.
---
🎁 Concrete Benefits You Receive
💫 1. Predictive Intelligence
- Know probable price destinations before they're reached
- Eliminate guesswork in setting profit targets
- Make informed decisions about trade direction
🎯 2. Mathematical Precision
- Every zone placement has mathematical justification
- No subjective interpretation required
- Consistent application across all market conditions
🌍 3. Universal Market Application
- Works identically on forex, stocks, crypto, commodities
- No need to adjust parameters for different instruments
- Mathematical principles transcend market types
🏆 4. Professional-Grade Analysis
- Access to institutional-level mathematical modeling
- Same complexity as quantitative hedge fund systems
- Simplified visual output for practical trading
✅ 5. Real-Time Performance Validation
- Built-in statistics track actual prediction accuracy
- Transparent performance measurement
- Data-driven confidence in signal quality
🛡️ 6. Risk Management Precision
- Mathematically-defined probable targets of desired and undesired price locations
- Systematic approach eliminates emotional decisions
⏱️ 7. Multi-Timeframe Consistency
- Zones maintain mathematical validity across timeframes
- Higher timeframe bias with lower timeframe precision
- Coherent analysis from scalping to position trading
---
🌟 Novel Trading Advantages
Probability-Based Targeting: Instead of hoping price reaches your target, you're trading toward mathematically-calculated probability zones.
Chaos Pattern Recognition: Probability-based predictions of the underlying chaotic patterns that govern price movement gives you an edge other traders don't possess.
Dynamic Adaptation: Unlike static indicators, this system continuously recalculates based on evolving market mathematics.
---
🔄 Why This Represents a Trading Evolution
From Reactive to Predictive: Traditional analysis tells you what happened. Chaos theory mathematics tells you what's likely to happen.
From Subjective to Objective: No more debating support and resistance levels. Mathematics determines probable price destinations.
From Curve-Fitted to Universal: Based on fundamental mathematical principles that work consistently across all markets and timeframes.
From Emotional to Systematic: Clear mathematical signals eliminate the psychological challenges that destroy most traders.
This indicator doesn't just give you another way to analyze markets - it gives you access to an entirely different mathematical framework for understanding price behavior. You're not getting a variation of existing concepts; you're getting a completely novel approach based on advanced mathematical principles that treat markets as the complex systems they actually are.
---
📚 How to Use the Indicator
🎨 Zone Mechanics
• Orange Zones: Target areas for price expansion
• Activation Trigger: Price must close outside any zone (full candle body, not just wicks)
• Primary Rule: Price travels to the next zone before closing back behind the originating zone border
🔴 Understanding the Red Dots
• Red dots on chart: Represent areas where we had valid zone sets available for trading
• Empty spaces indicate: Areas where price closed past the highest/lowest zone or where zone invalidation occurred
• Important note: We cannot always identify zones. Simply wait or switch timeframe/symbol

Advanced Market Dashboard - Compact Atr,bb,Dcng%,RSI,ADX,vwapDescription of the Advanced Market Dashboard Indicator:
This Pine Script indicator is a comprehensive technical dashboard designed for use with TradingView. The indicator displays key market metrics, price changes, and popular technical indicators directly on the chart in real-time.
Features of the Indicator
1. Price and Price Change
Current Price: Displays the current closing price of the symbol (e.g., $100.50).
Change in Price:
Value Change: Displays how much the price has changed compared to the previous period (e.g., "+$2.50").
Percentage Change: Shows the percentage difference between the previous period's close and the current price (e.g., "+2.5%").
Period Selection: Allows you to choose the time period for this change (e.g., 1 minute, daily, weekly, or monthly).
Example:
Current Price = $150.50
Change = +$1.25 (+0.83%)
2. VWAP (Volume Weighted Average Price)
VWAP represents the average price of a security weighted by volume. It’s widely used by intraday traders to gauge where the market price is relative to typical buying/selling levels.
Plot of VWAP is included on the chart for easy visualization.
3. ATR (Average True Range)
Displays ATR (21 period), an indicator commonly used for understanding price volatility.
Higher ATR values indicate higher volatility, while lower ATR values suggest lower volatility.
4. RSI (Relative Strength Index)
Displays RSI (21 period):
RSI is a popular oscillator that measures price momentum strength.
Ranges from 0 to 100:
Values above 70 indicate overbought conditions.
Values below 30 indicate oversold conditions.
Includes visual overbought/oversold lines (70 and 30) plotted directly on the chart.
5. ADX (Average Directional Index)
Displays ADX (14 period), which measures the strength of a trend:
ADX above 25: Indicates a strong trend.
ADX below 25: Indicates weak or no trend.
Includes a reference line (25) plotted on the chart to help interpret trend direction.
6. Bollinger Bands
Displays:
Upper Band: Basis + (StdDev × multiplier)
Lower Band: Basis - (StdDev × multiplier)
Middle Line: Simple Moving Average (SMA)
Bollinger Bands help identify volatility and potential buy/sell opportunities:
Price near the upper band: Indicates overbought conditions.
Price near the lower band: Indicates oversold conditions.
Plots all three bands directly on the chart for visual guidance.
Compact Table
The indicator organizes all data into a clean, compact table in the top-right corner of the chart. Each metric is displayed alongside its value:
Symbol Name and Price
Example:
Price Change
Example:
VWAP
Example:
ATR
Example:
RSI
Example:
ADX
Example:
Bollinger Upper Band
Example:
Bollinger Lower Band
Example:
Visual Plots on Chart
In addition to the table display, the following indicators are visually plotted on the chart for easy reference:
VWAP
Bollinger Bands (Upper, Lower, and Middle)
RSI Overbought/oversold levels
ADX Trend strength reference line (value = 25)
Customizable Settings
ATR Length: Default = 21.
RSI Length: Default = 21.
ADX Length: Default = 14.
Bollinger Band Parameters:
Length: Default = 20.
Standard Deviation: Default = 2.0.
Price Change Periods: Choose between:
1-minute
Daily
Weekly
Monthly.
How to Use
Add the script to your TradingView chart.
In the indicator settings, configure lengths and periods according to your preference.
Use the compact table for real-time metrics and refer to the chart plots for visual insights.
Who Should Use This Indicator?
This indicator is ideal for:
Day Traders: Use VWAP, ATR, RSI, and Bollinger Bands for intraday price action.
Trend Followers: Use ADX to confirm trending markets.
Technical Analysts: Quickly access multiple technical metrics without adding multiple indicators.
Swing Traders: Use Bollinger Bands and RSI for spotting overbought/oversold conditions.
Why This Indicator Stands Out?
Multiple Indicators in One: Eliminates the need to add separate indicators for VWAP, ATR, RSI, ADX, Bollinger Bands, and price changes.
Compact Design: Data displayed neatly in a table to reduce chart clutter.
Customizability: Users can fine-tune settings for their specific trading style.
Real-time Updates: Values are recalculated dynamically on each new bar, ensuring accuracy.
Limitations
This indicator is solely designed for informational purposes and does not provide buy/sell signals automatically.
The accuracy of Bollinger Bands, RSI, VWAP, etc., depends on the selected input parameters.
The price change feature may not work for extended periods in tick charts or non-standard timeframes.
Conclusion
This Advanced Market Dashboard is a powerful all-in-one tool for traders and analysts who require real-time market metrics. It combines essential indicators while maintaining a user-friendly interface for both novice and professional traders.

Mara JPY Strength (USDJPY+EURJPY+GBPJPY)/3 + DXYJPY, USDJPY, EURJPY, GBPJPY, smart money, bias, index, forex indicator, DXY, strength meter, professional, trading tool, price action

kaka-Buff横盘系统与CVD和LVP
作用:此指标用于识别市场横盘(震荡)区间,检测累积成交量差额(CVD)背离(基于分形和参考方法),并标记基于大成交量K线的关键价格水平(Large Volume Price, LVP)。它通过结合横盘信号、成交量背离和关键价格水平,帮助交易者识别潜在的趋势反转或延续。指标还绘制可自定义的指数移动平均线(EMA)以辅助趋势分析。主要功能:横盘检测:使用EMA标准差(STD)、平均真实波幅(ATR)、平均方向指数(ADX)和布林带宽度(BB宽度)识别低波动性的横盘区间。
分形CVD背离:通过分形枢轴点和成交量差额计算,检测看涨(“+RD”)和看跌(“-RD”)背离,以标签形式显示在图表上。
参考CVD背离:在成交量分布区域(VAH、VAL、POC)内识别简单的CVD背离(基于价格和成交量差额高/低点),以绿色/红色三角形显示。
大成交量价格(LVP):在回看周期(可自主设置长度)内标记最大成交量K线的最高/最低价,绘制线和标签,指示关键支撑/阻力位。
EMA线:绘制20、50、100和200周期的EMA,带开关控制和可自定义颜色,用于趋势可视化。
表格:以可自定义的表格(字体大小/颜色均可调节)显示横盘指标(EMA STD、ATR、ADX、BB宽度)和整体横盘状态。
警报:提供横盘进入/退出、分形CVD背离、参考CVD背离和LVP价格突破的警报。
Consolidation System with CVD and LVP
Purpose: This indicator identifies market consolidation zones, detects Cumulative Volume Delta (CVD) divergences (both fractal-based and reference-based), and marks significant price levels based on large volume bars (Large Volume Price, LVP). It helps traders identify potential trend reversals or continuations by combining consolidation signals, volume-based divergence, and key price levels. The indicator also plots customizable Exponential Moving Averages (EMAs) to aid in trend analysis.Key Features:Consolidation Detection: Uses EMA Standard Deviation (STD), Average True Range (ATR), Average Directional Index (ADX), and Bollinger Bands (BB) width to identify low-volatility consolidation zones.
Fractal CVD Divergence: Detects bullish ("+RD") and bearish ("-RD") divergences using fractal pivot points and a volume delta calculation, displayed as labels on the chart.
Reference CVD Divergence: Identifies simpler CVD divergences (based on price and volume delta highs/lows) within volume profile zones (VAH, VAL, POC), shown as green/red triangles.
Large Volume Price (LVP): Marks the high/low of the highest volume bar within a lookback period with lines and labels, indicating key support/resistance levels.
EMA Lines: Plots EMA 20, 50, 100, and 200 with toggle switches and customizable colors for trend visualization.
Table: Displays consolidation metrics (EMA STD, ATR, ADX, BB width) and overall consolidation status in a customizable table.
Alerts: Provides alerts for consolidation entry/exit, fractal CVD divergences, reference CVD divergences, and LVP price crossings.


Quarterly Dollar Volume Table (Dark Mode Optimized) Ogdn AmesThis is a visual reporting tool that gives you a historical view of how much dollar volume a stock had each quarter. Useful for spotting seasonal volume trends or changes in trading activity.
Think of it like an accountant's spreadsheet for stock liquidity—just with better automation and no coffee stains.


7* Previous Bar OHLC + 5m 20 EMAincreased label height for 7* Previous Bar OHLC + 5m 20 EMA. hope it helps :)
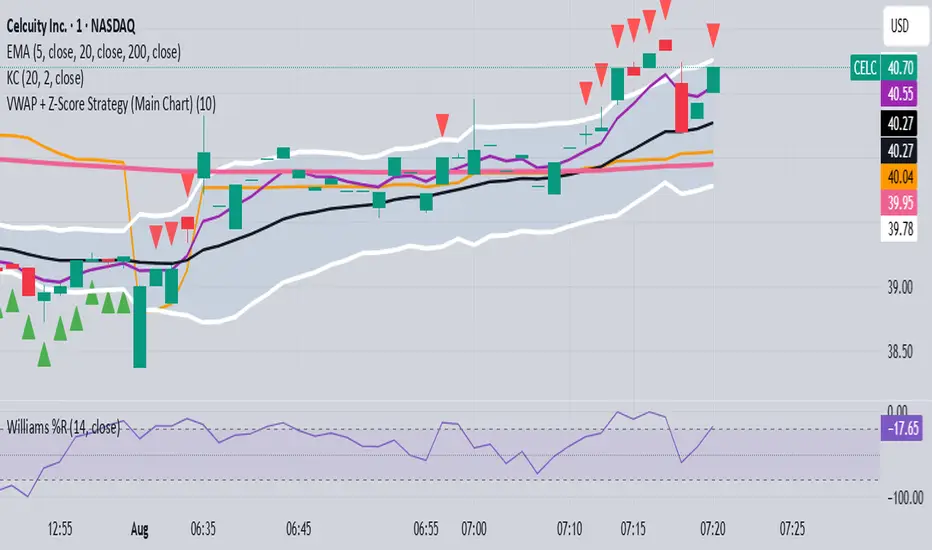
VWAP + Z-Score Strategy (Main Chart)🔹 Strategy: Z-Score Mean Reversion
Idea:
If a stock price moves far from its average, it might "snap back" toward the mean.
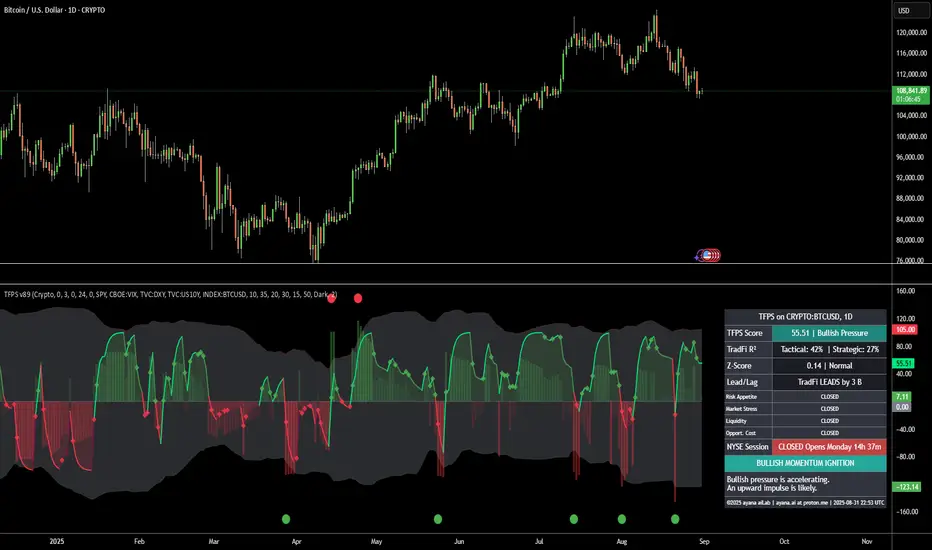
[ayana] TFPS - TradFi Pressure ScoreTFPS - TradFi Pressure Score: Your Market Pressure Barometer
Understand what moves Wall Street, before it moves Crypto.
This indicator is your real-time barometer for the influence of traditional financial markets (TradFi) on Crypto. It measures the combined pressure from four key quadrants—Risk Appetite (S&P 500), Market Stress (VIX), Liquidity (DXY), and Macro Expectations (US10Y)—to answer one question: "Do I have a tailwind or a headwind from the global markets?"
How to Read Your "Cockpit" in 60 Seconds
The Main Line (Overall Market Pressure)
GREEN / ABOVE 0: Bullish Tailwind. The macro environment is supportive for Crypto.
RED / BELOW 0: Bearish Headwind. The macro environment is creating pressure on Crypto.
BRIGHT Color: Pressure is ACCELERATING.
DARK Color: Pressure is DECELERATING (losing momentum).
The Dashboard (Your Command Center)
Lead/Lag Analysis: The game-changer. Tells you if TradFi is currently leading the price or vice-versa. This is your key to knowing whether to watch macro news or focus on crypto-specifics.
TradFi Influence (R²): Shows you HOW RELEVANT the macro pressure is right now. High R² means Wall Street's influence is dominant. Low R² means crypto is moving on its own narrative.
Dynamic Weights: Reveals the market's primary NARRATIVE. Is the pressure coming from Fear (VIX), Liquidity (DXY), or general Risk Appetite (SPX)?
Extreme Signals (Reversal Zones)
Stress Cloud (Z-Score): Large, opaque bars warn of statistically EXTREME greed or fear levels.
Extreme Dots: Pinpoint the moments when pressure has likely reached an unsustainable peak, often preceding turning points.
Key Strategies & Use Cases
As a Trend Filter: Simply avoid fighting the color. Don't force long trades when the TFPS shows a strong red headwind.
For Precision Entry/Exits: Use the Extreme Dots and a decelerating color on the Main Line to time your entries in confluence with your own strategy.
For Strategic Decisions: Use the Lead/Lag and R² metrics to decide where to focus your attention and how to manage portfolio risk based on the current macro regime.
Configuration
For best results, leave the engine settings on their default (auto-adaptive) mode. The indicator's core intelligence lies in its ability to adapt to changing market dynamics automatically. You can adjust the visual theme to match your chart.
Recession Warning Model [BackQuant]Recession Warning Model
Overview
The Recession Warning Model (RWM) is a Pine Script® indicator designed to estimate the probability of an economic recession by integrating multiple macroeconomic, market sentiment, and labor market indicators. It combines over a dozen data series into a transparent, adaptive, and actionable tool for traders, portfolio managers, and researchers. The model provides customizable complexity levels, display modes, and data processing options to accommodate various analytical requirements while ensuring robustness through dynamic weighting and regime-aware adjustments.
Purpose
The RWM fulfills the need for a concise yet comprehensive tool to monitor recession risk. Unlike approaches relying on a single metric, such as yield-curve inversion, or extensive economic reports, it consolidates multiple data sources into a single probability output. The model identifies active indicators, their confidence levels, and the current economic regime, enabling users to anticipate downturns and adjust strategies accordingly.
Core Features
- Indicator Families : Incorporates 13 indicators across five categories: Yield, Labor, Sentiment, Production, and Financial Stress.
- Dynamic Weighting : Adjusts indicator weights based on recent predictive accuracy, constrained within user-defined boundaries.
- Leading and Coincident Split : Separates early-warning (leading) and confirmatory (coincident) signals, with adjustable weighting (default 60/40 mix).
- Economic Regime Sensitivity : Modulates output sensitivity based on market conditions (Expansion, Late-Cycle, Stress, Crisis), using a composite of VIX, yield-curve, financial conditions, and credit spreads.
- Display Options : Supports four modes—Probability (0-100%), Binary (four risk bins), Lead/Coincident, and Ensemble (blended probability).
- Confidence Intervals : Reflects model stability, widening during high volatility or conflicting signals.
- Alerts : Configurable thresholds (Watch, Caution, Warning, Alert) with persistence filters to minimize false signals.
- Data Export : Enables CSV output for probabilities, signals, and regimes, facilitating external analysis in Python or R.
Model Complexity Levels
Users can select from four tiers to balance simplicity and depth:
1. Essential : Focuses on three core indicators—yield-curve spread, jobless claims, and unemployment change—for minimalistic monitoring.
2. Standard : Expands to nine indicators, adding consumer confidence, PMI, VIX, S&P 500 trend, money supply vs. GDP, and the Sahm Rule.
3. Professional : Includes all 13 indicators, incorporating financial conditions, credit spreads, JOLTS vacancies, and wage growth.
4. Research : Unlocks all indicators plus experimental settings for advanced users.
Key Indicators
Below is a summary of the 13 indicators, their data sources, and economic significance:
- Yield-Curve Spread : Difference between 10-year and 3-month Treasury yields. Negative spreads signal banking sector stress.
- Jobless Claims : Four-week moving average of unemployment claims. Sustained increases indicate rising layoffs.
- Unemployment Change : Three-month change in unemployment rate. Sharp rises often precede recessions.
- Sahm Rule : Triggers when unemployment rises 0.5% above its 12-month low, a reliable recession indicator.
- Consumer Confidence : University of Michigan survey. Declines reflect household pessimism, impacting spending.
- PMI : Purchasing Managers’ Index. Values below 50 indicate manufacturing contraction.
- VIX : CBOE Volatility Index. Elevated levels suggest market anticipation of economic distress.
- S&P 500 Growth : Weekly moving average trend. Declines reduce wealth effects, curbing consumption.
- M2 + GDP Trend : Monitors money supply and real GDP. Simultaneous declines signal credit contraction.
- NFCI : Chicago Fed’s National Financial Conditions Index. Positive values indicate tighter conditions.
- Credit Spreads : Proxy for corporate bond spreads using 10-year vs. 2-year Treasury yields. Widening spreads reflect stress.
- JOLTS Vacancies : Job openings data. Significant drops precede hiring slowdowns.
- Wage Growth : Year-over-year change in average hourly earnings. Late-cycle spikes often signal economic overheating.
Data Processing
- Rate of Change (ROC) : Optionally applied to capture momentum in data series (default: 21-bar period).
- Z-Score Normalization : Standardizes indicators to a common scale (default: 252-bar lookback).
- Smoothing : Applies a short moving average to final signals (default: 5-bar period) to reduce noise.
- Binary Signals : Generated for each indicator (e.g., yield-curve inverted or PMI below 50) based on thresholds or Z-score deviations.
Probability Calculation
1. Each indicator’s binary signal is weighted according to user settings or dynamic performance.
2. Weights are normalized to sum to 100% across active indicators.
3. Leading and coincident signals are aggregated separately (if split mode is enabled) and combined using the specified mix.
4. The probability is adjusted by a regime multiplier, amplifying risk during Stress or Crisis regimes.
5. Optional smoothing ensures stable outputs.
Display and Visualization
- Probability Mode : Plots a continuous 0-100% recession probability with color gradients and confidence bands.
- Binary Mode : Categorizes risk into four levels (Minimal, Watch, Caution, Alert) for simplified dashboards.
- Lead/Coincident Mode : Displays leading and coincident probabilities separately to track signal divergence.
- Ensemble Mode : Averages traditional and split probabilities for a balanced view.
- Regime Background : Color-coded overlays (green for Expansion, orange for Late-Cycle, amber for Stress, red for Crisis).
- Analytics Table : Optional dashboard showing probability, confidence, regime, and top indicator statuses.
Practical Applications
- Asset Allocation : Adjust equity or bond exposures based on sustained probability increases.
- Risk Management : Hedge portfolios with VIX futures or options during regime shifts to Stress or Crisis.
- Sector Rotation : Shift toward defensive sectors when coincident signals rise above 50%.
- Trading Filters : Disable short-term strategies during high-risk regimes.
- Event Timing : Scale positions ahead of high-impact data releases when probability and VIX are elevated.
Configuration Guidelines
- Enable ROC and Z-score for consistent indicator comparison unless raw data is preferred.
- Use dynamic weighting with at least one economic cycle of data for optimal performance.
- Monitor stress composite scores above 80 alongside probabilities above 70 for critical risk signals.
- Adjust adaptation speed (default: 0.1) to 0.2 during Crisis regimes for faster indicator prioritization.
- Combine RWM with complementary tools (e.g., liquidity metrics) for intraday or short-term trading.
Limitations
- Macro indicators lag intraday market moves, making RWM better suited for strategic rather than tactical trading.
- Historical data availability may constrain dynamic weighting on shorter timeframes.
- Model accuracy depends on the quality and timeliness of economic data feeds.
Final Note
The Recession Warning Model provides a disciplined framework for monitoring economic downturn risks. By integrating diverse indicators with transparent weighting and regime-aware adjustments, it empowers users to make informed decisions in portfolio management, risk hedging, or macroeconomic research. Regular review of model outputs alongside market-specific tools ensures its effective application across varying market conditions.

Step 3: Multi-Timeframe Trading SessionsFor editing purposes,
This is for editing purposes for developer to edit it before publishing.

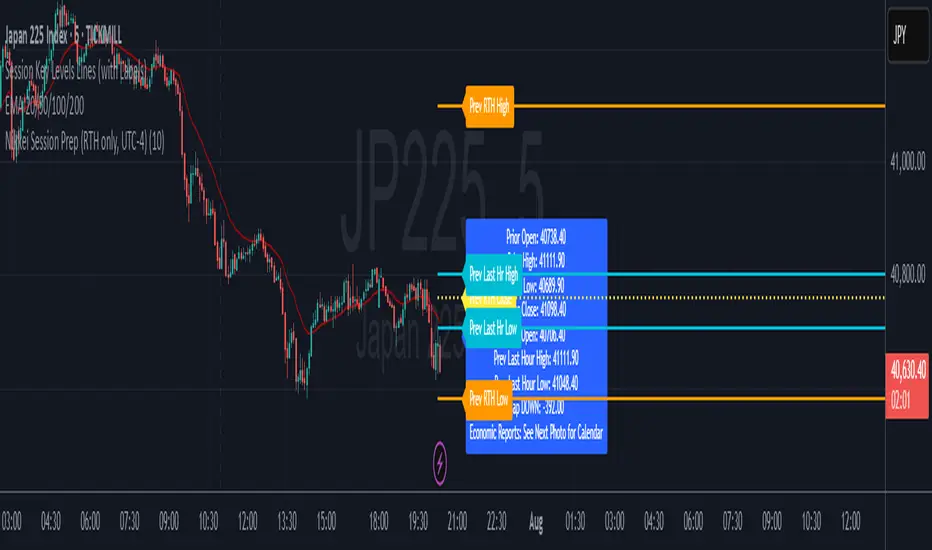
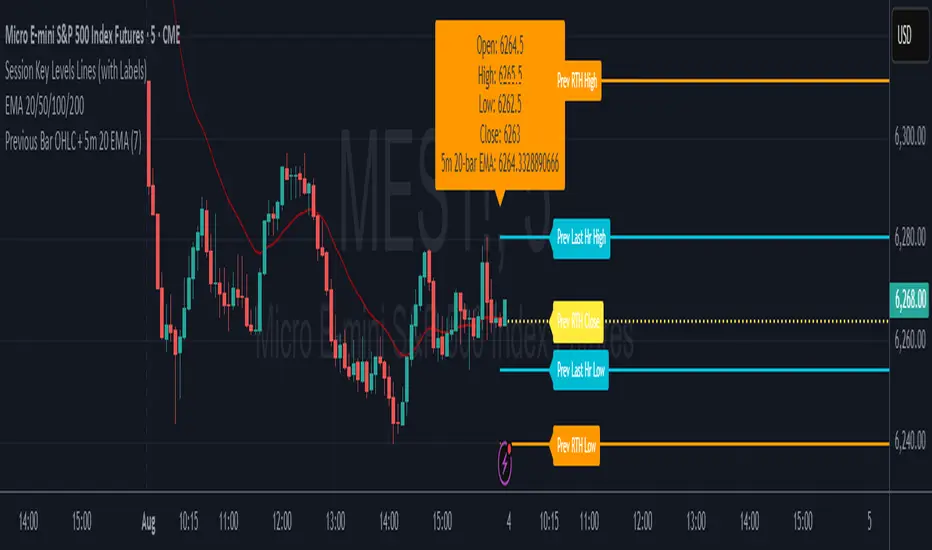
Nikkei Session Key Levels Lines (with Labels) - Nikkei CFDThis is Nikkei Session Key Levels Lines (with Labels) - Nikkei CFD. shows you all the key level lines that you need to be aware. hope it helps :)

Nikkei Premarket High/Low LabelThis is Nikkei Premarket High/Low Label. shows you the premarket high and low. hope it helps :)
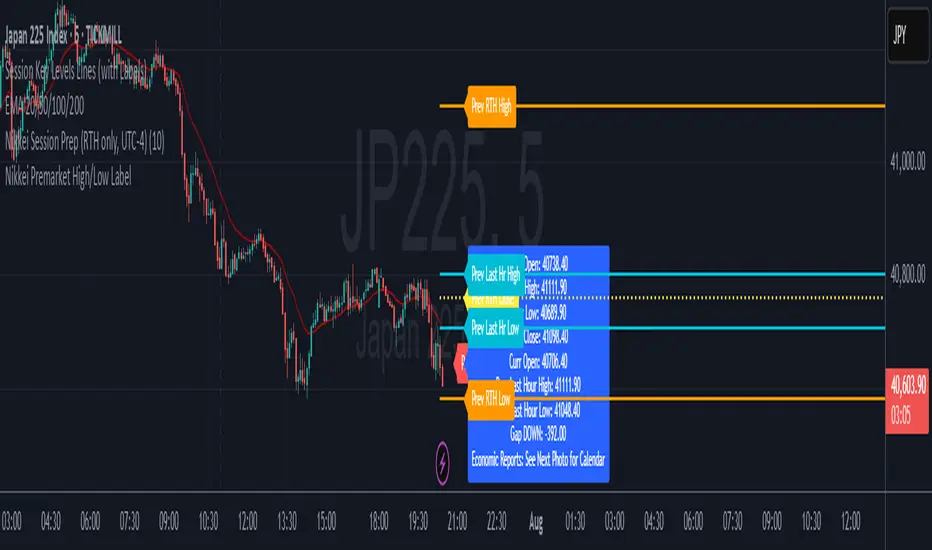
Nikkei Session Prep (RTH only, UTC-4)This is Nikkei Session Prep (RTH only, UTC-4). hope it helps :)