포지션 계산기이 지표는 트레이더가 설정한 리스크에 맞춰 **적정 진입금액(포지션 사이즈)**을 자동으로 계산해주는 도구입니다.
사용자가 입력하는 값:
레버리지
손절 거리(%)
손실 허용 금액($)
위 세 가지를 입력하면,
지표가 즉시 현재 리스크에 맞는 진입금액을 계산해 표시해줍니다.
복잡한 계산 없이 차트 상에서 바로 포지션 크기를 산출할 수 있어,
리스크 관리의 일관성을 유지하는 데 매우 유용합니다.
주요 기능
직관적인 UI로 빠른 값 조정 가능
실시간 진입금액(포지션 사이즈) 계산
선물·마진·레버리지 거래에 모두 활용 가능
고정 손실금 기반 전략(Risk Fixed Dollar)에 최적화
이 계산기를 사용하면,
시장 변동성과 무관하게 항상 동일한 리스크로 거래 진입이 가능합니다.
----------------------------------------------------------------------------------------------------------
Position Calculator – Entry Size Based on Risk
This indicator helps traders automatically calculate the optimal entry amount based on their predefined risk parameters.
Simply input:
Leverage
Stop Distance (%)
Loss Amount ($)
The script instantly returns the required entry size to match your risk level.
It helps maintain consistent risk management and prevents oversizing positions during volatile market conditions.
Key Features
Clean, minimal UI for quick adjustments
Real-time calculation of position size
Suitable for futures, margin, and leveraged trading
Ideal for traders who use fixed-dollar risk per trade
This tool ensures you always enter with the correct size—no external calculator needed.
Statistics

Kernel Channel [BackQuant]Kernel Channel
A non-parametric, kernel-weighted trend channel that adapts to local structure, smooths noise without lagging like moving averages, and highlights volatility compressions, expansions, and directional bias through a flexible choice of kernels, band types, and squeeze logic.
What this is
This indicator builds a full trend channel using kernel regression rather than classical averaging. Instead of a simple moving average or exponential weighting, the midline is computed as a kernel-weighted expectation of past values. This allows it to adapt to local shape, give more weight to nearby bars, and reduce distortion from outliers.
You can think of it as a sliding local smoother where you define both the “window” of influence (Window Length) and the “locality strength” (Bandwidth). The result is a flexible midline with optional upper and lower bands derived from kernel-weighted ATR or kernel-weighted standard deviation, letting you visualize volatility in a structurally consistent way.
Three plotting modes help demonstrate this difference:
When the midline is shown alone, you get a smooth, adaptive baseline that behaves almost like a regression moving average, as shown in this view:
When full channels are enabled, you see how standard deviation reacts to local structure with dynamically widening and tightening bands, a mode illustrated here:
When ATR mode is chosen instead of StdDev, band width reflects breadth of movement rather than variance, creating a volatility-aware envelope like the example here:
Why kernels
Classical moving averages allocate fixed weights. Kernels let the user define weighting shape:
Epanechnikov — emphasizes bars near the current bar, fades fast, stable and smooth.
Triangular — linear decay, simple and responsive.
Laplacian — exponential decay from the current point, sharper reactivity.
Cosine — gentle periodic decay, balanced smoothness for trend filters.
Using these in combination with a bandwidth parameter gives fine control over smoothness vs responsiveness. Smaller bandwidths give sharper local sensitivity, larger bandwidths give smoother curvature.
How it works (core logic)
The indicator computes three building blocks:
1) Kernel-weighted midline
For every bar, a sliding window looks back Window Length bars. Each bar in this window receives a kernel weight depending on:
its index distance from the present
the chosen kernel shape
the bandwidth parameter (locality)
Weights form the denominator, weighted values form the numerator, and the resulting ratio is the kernel regression mean. This midline is the central trend.
2) Kernel-based width
You choose one of two band types:
Kernel ATR — ATR values are kernel-averaged, producing a smooth, volatility-based width that is not dependent on variance. Ideal for directional trend channels and regime separation.
Kernel StdDev — local variance around the midline is computed through kernel weighting. This produces a true statistical envelope that narrows in quiet periods and widens in noisy areas.
Width is scaled using Band Multiplier , controlling how far the envelope extends.
3) Upper and lower channels
Provided midline and width exist, the channel edges are:
Upper = midline + bandMult × width
Lower = midline − bandMult × width
These create smooth structures around price that adapt continuously.
Plotting modes
The indicator supports multiple visual styles depending on what you want to emphasize.
When only the midline is displayed, you get a pure kernel trend: a smooth regression-like curve that reacts to local structure while filtering noise, demonstrated here: This provides a clean read on direction and slope.
With full channels enabled, the behavior of the bands becomes visible. Standard deviation mode creates elastic boundaries that tighten during compressions and widen during turbulence, which you can see in the band-focused demonstration: This helps identify expansion events, volatility clusters, and breakouts.
ATR mode shifts interpretation from statistical variance to raw movement amplitude. This makes channels less sensitive to outliers and more consistent across trend phases, as shown in this ATR variation example: This mode is particularly useful for breakout systems and bar-range regimes.
Regime detection and bar coloring
The slope of the midline defines directional bias:
Up-slope → green
Down-slope → red
Flat → gray
A secondary regime filter compares close to the channel:
Trend Up Strong — close above upper band and midline rising.
Trend Down Strong — close below lower band and midline falling.
Trend Up Weak — close between midline and upper band with rising slope.
Trend Down Weak — close between lower band and midline with falling slope.
Compression mode — squeeze conditions.
Bar coloring is optional and can be toggled for cleaner charts.
Squeeze logic
The indicator includes non-standard squeeze detection based on relative width , defined as:
width / |midline|
This gives a dimensionless measure of how “tight” or “loose” the channel is, normalized for trend level.
A rolling window evaluates the percentile rank of current width relative to past behavior. If the width is in the lowest X% of its last N observations, the script flags a squeeze environment. This highlights compression regions that may precede breakouts or regime shifts.
Deviation highlighting
When using Kernel StdDev mode, you may enable deviation flags that highlight bars where price moves outside the channel:
Above upper band → bullish momentum overextension
Below lower band → bearish momentum overextension
This is turned off in ATR mode because ATR widths do not represent distributional variance.
Alerts included
Kernel Channel Long — midline turns up.
Kernel Channel Short — midline turns down.
Price Crossed Midline — crossover or crossunder of the midline.
Price Above Upper — early momentum expansion.
Price Below Lower — downward volatility expansion.
These help automate regime changes and breakout detection.
How to use it
Trend identification
The midline acts as a bias filter. Rising midline means trend strength upward, falling midline means downward behavior. The channel width contextualizes confidence.
Breakout anticipation
Kernel StdDev compressions highlight areas where price is coiling. Breakouts often follow narrow relative width. ATR mode provides structural expansion cues that are smooth and robust.
Mean reversion
StdDev mode is suitable for fade setups. Moves to outer bands during low volatility often revert to the midline.
Continuation logic
If price breaks above the upper band while midline is rising, the indicator flags strong directional expansion. Same logic for breakdowns on the lower band.
Volatility characterization
Kernel ATR maps raw bar movements and is excellent for identifying regime shifts in markets where variance is unstable.
Tuning guidance
For smoother long-term trend tracking
Larger window (150–300).
Moderate bandwidth (1.0–2.0).
Epanechnikov or Cosine kernel.
ATR mode for stable envelopes.
For swing trading / short-term structure
Window length around 50–100.
Bandwidth 0.6–1.2.
Triangular for speed, Laplacian for sharper reactions.
StdDev bands for precise volatility compression.
For breakout systems
Smaller bandwidth for sharp local detection.
ATR mode for stable envelopes.
Enable squeeze highlighting for identifying setups early.
For mean-reversion systems
Use StdDev bands.
Moderate window length.
Highlight deviations to locate overextended bars.
Settings overview
Kernel Settings
Source
Window Length
Bandwidth
Kernel Type (Epanechnikov, Triangular, Laplacian, Cosine)
Channel Width
Band Type (Kernel ATR or Kernel StdDev)
Band Multiplier
Visuals
Show Bands
Color Bars By Regime
Highlight Squeeze Periods
Highlight Deviation
Lookback and Percentile settings
Colors for uptrend, downtrend, squeeze, flat
Trading applications
Trend filtering — trade only in direction of the midline slope.
Breakout confirmation — expansion outside the bands while slope agrees.
Squeeze timing — compression periods often precede the next directional leg.
Volatility-aware stops — ATR mode makes channel edges suitable for adaptive stop placement.
Structural swing mapping — StdDev bands help locate midline pullbacks vs distributional extremes.
Bias rotation — bar coloring highlights when regime shifts occur.
Notes
The Kernel Channel is not a signal generator by itself, but a structural map. It helps classify trend direction, volatility environment, distribution shape, and compression cycles. Combine it with your entry and exit framework, risk parameters, and higher-timeframe confirmation.
It is designed to behave consistently across markets, to avoid the bluntness of classical averages, and to reveal subtle curvature in price that traditional channels miss. Adjust kernel type, bandwidth, and band source to match the noise profile of your instrument, then use squeeze logic and deviation highlighting to guide timing.

Indices ALN SessionsIndices ALN Sessions - Pattern Analysis with Historical Probabilities
Overview
This indicator analyzes overnight trading patterns across Asia, London, and New York sessions for major index futures (NQ, ES, YM), providing real-time probability analysis based on 15 years of historical data (2010-2025).
Pattern Detection Methodology
The indicator detects four distinct overnight patterns by comparing session high/low relationships:
1. London Engulfs Asia
Condition: London High > Asia High AND London Low < Asia Low
Interpretation: London session completely engulfed the Asia range
2. Asia Engulfs London
Condition: Asia High > London High AND Asia Low < London Low
Interpretation: London session remained within Asia's range
3. London Partial Up
Condition: London High > Asia High AND London Low ≥ Asia Low
Interpretation: London broke Asia high but not its low
4. London Partial Down
Condition: London Low < Asia Low AND London High ≤ Asia High
Interpretation: London broke Asia low but not the high
Probability Calculation
Probabilities are derived from historical analysis of 1-minute price data spanning 2010-2025 across all three indices. The system tracks:
Primary Targets: Most likely level to be taken during NY session based on pattern
Secondary Targets: Second most likely level
Asia Targets: Probability of reaching untouched Asia levels (for partial patterns)
Engulfment Probability: Likelihood of NY session taking all four levels
Day-of-Week Specificity
Each pattern has unique probability profiles for Monday through Friday, as market behavior varies significantly by day. The indicator automatically selects the appropriate probability set based on the current trading day.
Conditional Probability Logic
The indicator dynamically adjusts probabilities as levels are taken during the NY session:
When the Primary target is taken first → Shows conditional probability for Secondary target
When Secondary is taken before Primary → Adjusts Primary probability based on historical sequences
Real-time tracking shows which levels have been hit with checkmark confirmations
How Probabilities Were Derived
Data was collected from 15 years of 1-minute futures data for NQ, ES, and YM. For each trading day:
Asia session high/low recorded (8:00 PM - 2:00 AM EST)
London session high/low recorded (2:00 AM - 8:00 AM EST)
Pattern type classified
NY session behavior tracked (8:00 AM - 4:00 PM EST)
Level breaks recorded with sequence order
Statistical frequencies calculated by pattern, day, and instrument
Sample sizes vary but typically include 200-500+ occurrences per pattern/day combination over the 15-year period.
Visual Components
Session Boxes: Color-coded rectangles showing Asia (Yellow), London (Blue), and NY (Red) sessions with their high/low ranges.
Pivot Lines: Horizontal lines marking session highs and lows that extend until broken or until the drawing cutoff time.
Pattern Labels: Automatic labeling at NY open identifying which of the four patterns has formed.
Probability Table: Real-time table showing:
Current pattern type
Instrument type (NQ/ES/YM) and day of week
Sample size (when using dynamic stats)
Primary, Secondary, and Asia target probabilities
Engulfment probability
Live confirmations as levels are taken
Color Coding:
Green background: 70%+ probability
Lime: 50-70% probability
Orange: 30-50% probability
Red: Confirmed (level taken)
Settings & Inputs
Historical Stats
Instrument Type: Select NQ, ES, or YM (each has unique probability data)
Use Dynamic Stats: Toggle between historical probabilities and live collection mode
Sessions:
Customizable session times (default: Asia 8PM-2AM, London 2AM-8AM, NY 8AM-4PM EST)
Session box transparency and colors
Toggle session boxes and text on/off
Pivots:
Show/hide pivot lines and labels
Extend pivots until mitigated or past mitigation
Alert when pivots are broken
Midpoint display option
Probabilities:
Show/hide probability table
Table position and size customization
Pattern label display toggle
Opening Prices:
Optional horizontal lines at key times (midnight,18:00, 09:30, etc.)
How to Use:
Apply to 5-minute chart of NQ, ES, or YM futures
Select your instrument in settings to match the chart
Wait for NY session open - Pattern will be identified and probabilities displayed
Monitor the probability table - Primary targets show highest probability levels
Watch for confirmations - Checkmarks appear as levels are taken
Note conditional updates - Probabilities adjust based on which level breaks first
Trading Applications:
Directional bias: High probability targets suggest likely NY session movement
Level awareness: Know which session highs/lows are most likely to be tested
Risk management: Lower probability scenarios may warrant tighter stops
Sequence planning: Conditional probabilities help anticipate multi-level moves
What Makes This Different:
Unlike standard session indicators that only display ranges, this tool:
Classifies specific overnight pattern formations:
Provides quantified probabilities based on extensive historical analysis
Updates in real-time with conditional logic as the session develops
Distinguishes between different indices (NQ/ES/YM) and days of week
Tracks level-break sequences, not just final outcomes
Notes:
Probabilities are based on historical frequencies and do not guarantee future results
Best used on 1, 5, and 15-minute timeframes for optimal session visualization
Works on continuous futures contracts or /NQ, /ES, /YM symbols

Alt Trading: FuturesOne
The FuturesOne Indicator + Strategy will be continuously enhanced to ensure our users receive the most effective and profit-focused trading system at the best possible value. Version 0 (V0) of the FuturesOne Strategy is built on a refined Opening Range Breakout (ORB) framework, augmented with a quantitative regime-detection and filtering layer. This design allows users to tailor their approach: they may opt for consistent daily ORB opportunities or select a mode that applies quantitative filters to surface fewer, but higher-probability, trade setups.

STRATEGY 1 │ Red Dragon │ Model 1 │ Pro │ [Titans_Invest]The Red Dragon Model 1 is a fully automated trading strategy designed to operate BTC/USDT.P on the 4-hour chart with precision, stability, and consistency. It was built to deliver reliable behavior even during strong market movements, maintaining operational discipline and avoiding abrupt variations that could interfere with the trader’s decision-making.
Its core is based on a professionally engineered logical structure that combines trend filters, confirmation criteria, and balanced risk management. Every component was designed to work in an integrated way, eliminating noise, avoiding unnecessary trades, and protecting capital in critical moments. There are no secret mechanisms or hidden logic: everything is built to be objective, clean, and efficient.
Even though it is based on professional quantitative engineering, Red Dragon Model 1 remains extremely simple to operate. All logic is clearly displayed and fully accessible within TradingView itself, making it easy to understand for both beginners and experienced traders. The structure is organized so that any user can quickly view entry conditions, exit criteria, additional filters, adjustable parameters, and the full mechanics behind the strategy’s behavior.
In addition, the architecture was built to minimize unnecessary complexity. Parameters are straightforward, intuitive, and operate in a balanced way without requiring deep adjustments or advanced knowledge. Traders have full freedom to analyze the strategy, understand the logic, and make personal adaptations if desired—always with total transparency inside TradingView.
The strategy was also designed to deliver consistent operational behavior over the long term. Its confirmation criteria reduce impulsive trades; its filters isolate noise; and its overall logic prioritizes high-quality entries in structured market movements. The goal is to provide a stable, clear, and repeatable flow—essential characteristics for any medium-term quantitative approach.
Combining clarity, professional structure, and ease of use, Red Dragon Model 1 offers a solid foundation both for users who want a ready-to-use automated strategy and for those looking to study quantitative models in greater depth.
This entire project was built with extreme dedication, backed by more than 14,000 hours of hands-on experience in Pine Script, continuously refining patterns, techniques, and structures until reaching its current level of maturity. Every line of code reflects this long process of improvement, resulting in a strategy that unites professional engineering, transparency, accessibility, and reliable execution.
🔶 MAIN FEATURES
• Fully automated and robust: Operates without manual intervention, ideal for traders seeking consistency and stability. It delivers reliable performance even in volatile markets thanks to the solid quantitative engineering behind the system.
• Multiple layers of confirmation: Combines 10 key technical indicators with 15 adaptive filters to avoid false signals. It only triggers entries when all trend, market strength, and contextual criteria align.
• Configurable and adaptable filters: Each of the 15 filters can be enabled, disabled, or adjusted by the user, allowing the creation of personalized statistical models for different assets and timeframes. This flexibility gives full freedom to optimize the strategy according to individual preferences.
• Clear and accessible logic: All entry and exit conditions are explicitly shown within the TradingView parameters. The strategy has no hidden components—any user can quickly analyze and understand each part of the system.
• Integrated exclusive tools: Includes complete backtest tables (desktop and mobile versions) with annualized statistics, along with real-time entry conditions displayed directly on the chart. These tools help monitor the strategy across devices and track performance and risk metrics.
• No repaint: All signals are static and do not change after being plotted. This ensures the trader can trust every entry shown without worrying about indicators rewriting past values.
🔷 ENTRY CONDITIONS & RISK MANAGEMENT
Red Dragon Model 1 triggers buy (long) or sell (short) signals only when all configured conditions are satisfied. For example:
• Volume:
• The system only trades when current volume exceeds the volume moving average multiplied by a user-defined factor, indicating meaningful market participation.
• RSI:
• Confirms bullish bias when RSI crosses above its moving average, and bearish bias when crossing below.
• ADX:
• Enters long when +DI is above –DI with ADX above a defined threshold, indicating directional strength to the upside (and the opposite conditions for shorts).
• Other indicators (MACD, SAR, Ichimoku, Support/Resistance, etc.)
Each one must confirm the expected direction before a final signal is allowed.
When all bullish criteria are met simultaneously, the system enters Long; when all criteria indicate a bearish environment, the system enters Short.
In addition, the strategy uses fixed Take Profit and Stop Loss targets for risk control:
Currently: TP around 1.5% and SL around 2.0% per trade, ensuring consistent and transparent risk management on every position.
⚙️ INDICATORS
__________________________________________________________
1) 🔊 Volume: Avoids trading on flat charts.
2) 🍟 MACD: Tracks momentum through moving averages.
3) 🧲 RSI: Indicates overbought or oversold conditions.
4) 🅰️ ADX: Measures trend strength and potential entry points.
5) 🥊 SAR: Identifies changes in price direction.
6) ☁️ Cloud: Accurately detects changes in market trends.
7) 🌡️ R/F: Improves trend visualization and helps avoid pitfalls.
8) 📐 S/R: Fixed support and resistance levels.
9)╭╯MA: Moving Averages.
10) 🔮 LR: Forecasting using Linear Regression.
__________________________________________________________
🟢 ENTRY CONDITIONS 🔴
__________________________________________________________
IF all conditions are 🟢 = 📈 Long
IF all conditions are 🔴 = 📉 Short
__________________________________________________________
🚨 CURRENT TRIGGER SIGNAL 🚨
__________________________________________________________
🔊 Volume
🟢 LONG = (volume) > (MA_volume) * (Volume Mult)
🔴 SHORT = (volume) > (MA_volume) * (Volume Mult)
🧲 RSI
🟢 LONG = (RSI) > (RSI_MA)
🔴 SHORT = (RSI) < (RSI_MA)
🟢 ALL ENTRY CONDITIONS AVAILABLE 🔴
__________________________________________________________
🔊 Volume
🟢 LONG = (volume) > (MA_volume) * (Volume Mult)
🔴 SHORT = (volume) > (MA_volume) * (Volume Mult)
🔊 Volume
🟢 LONG = (volume) > (MA_volume) * (Volume Mult) and (close) > (open)
🔴 SHORT = (volume) > (MA_volume) * (Volume Mult) and (close) < (open)
🍟 MACD
🟢 LONG = (MACD) > (Signal Smoothing)
🔴 SHORT = (MACD) < (Signal Smoothing)
🧲 RSI
🟢 LONG = (RSI) < (Upper)
🔴 SHORT = (RSI) > (Lower)
🧲 RSI
🟢 LONG = (RSI) > (RSI_MA)
🔴 SHORT = (RSI) < (RSI_MA)
🅰️ ADX
🟢 LONG = (+DI) > (-DI) and (ADX) > (Treshold)
🔴 SHORT = (+DI) < (-DI) and (ADX) > (Treshold)
🥊 SAR
🟢 LONG = (close) > (SAR)
🔴 SHORT = (close) < (SAR)
☁️ Cloud
🟢 LONG = (Cloud A) > (Cloud B)
🔴 SHORT = (Cloud A) < (Cloud B)
☁️ Cloud
🟢 LONG = (Kama) > (Kama )
🔴 SHORT = (Kama) < (Kama )
🌡️ R/F
🟢 LONG = (high) > (UP Range) and (upward) > (0)
🔴 SHORT = (low) < (DOWN Range) and (downward) > (0)
🌡️ R/F
🟢 LONG = (high) > (UP Range)
🔴 SHORT = (low) < (DOWN Range)
📐 S/R
🟢 LONG = (close) > (Resistance)
🔴 SHORT = (close) < (Support)
╭╯MA2️⃣
🟢 LONG = (Cyan Bar MA2️⃣)
🔴 SHORT = (Red Bar MA2️⃣)
╭╯MA2️⃣
🟢 LONG = (close) > (MA2️⃣)
🔴 SHORT = (close) < (MA2️⃣)
╭╯MA2️⃣
🟢 LONG = (Positive MA2️⃣)
🔴 SHORT = (Negative MA2️⃣)
__________________________________________________________
🎯 TP / SL 🛑
__________________________________________________________
🎯 TP: 1.5 %
🛑 SL: 2.0 %
__________________________________________________________
🪄 UNIQUE FEATURES OF THIS STRATEGY
____________________________________
1) 𝄜 Table Backtest for Mobile.
2) 𝄜 Table Backtest for Computer.
3) 𝄜 Table Backtest for Computer & Annual Performance.
4) 𝄜 Live Entry Conditions.
1) 𝄜 Table Backtest for Mobile.
2) 𝄜 Table Backtest for Computer.
3) 𝄜 Table Backtest for Computer & Annual Performance.
4) 𝄜 Live Entry Conditions.
_____________________________
𝄜 BACKTEST / PERFORMANCE 𝄜
_____________________________
• Net Profit: +634.47%, Maximum Drawdown: -18.44%.
🪙 PAIR / TIMEFRAME ⏳
🪙 PAIR: BINANCE:BTCUSDT.P
⏳ TIME: 4 hours (240m)
✅ ON ☑️ OFF
✅ LONG
✅ SHORT
🎯 TP / SL 🛑
🎯 TP: 1.5 (%)
🛑 SL: 2.0 (%)
⚙️ CAPITAL MANAGEMENT
💸 Initial Capital: 10000 $ (TradingView)
💲 Order Size: 10 % (Of Equity)
🚀 Leverage: 10 x (Exchange)
💩 Commission: 0.03 % (Exchange)
📆 BACKTEST
🗓️ Start: Setember 24, 2019
🗓️ End: November 21, 2025
🗓️ Days: 2250
🗓️ Yers: 6.17
🗓️ Bars: 13502
📊 PERFORMANCE
💲 Net Profit: + 63446.89 $
🟢 Net Profit: + 634.47 %
💲 DrawDown Maximum: - 10727.48 $
🔴 DrawDown Maximum: - 18.44 %
🟢 Total Closed Trades: 1042
🟡 Percent Profitable: 63.92 %
🟡 Profit Factor: 1.247
💲 Avg Trade: + 60.89 $
⏱️ Avg # Bars in Trades
🕯️ Avg # Bars: 4
⏳ Avg # Hrs: 15
✔️ Trades Winning: 666
❌ Trades Losing: 376
✔️ Maximum Consecutive Wins: 11
❌ Maximum Consecutive Losses: 7
📺 Live Performance : br.tradingview.com
• Use this strategy on the recommended pair and timeframe above to replicate the tested results.
• Feel free to experiment and explore other settings, assets, and timeframes.

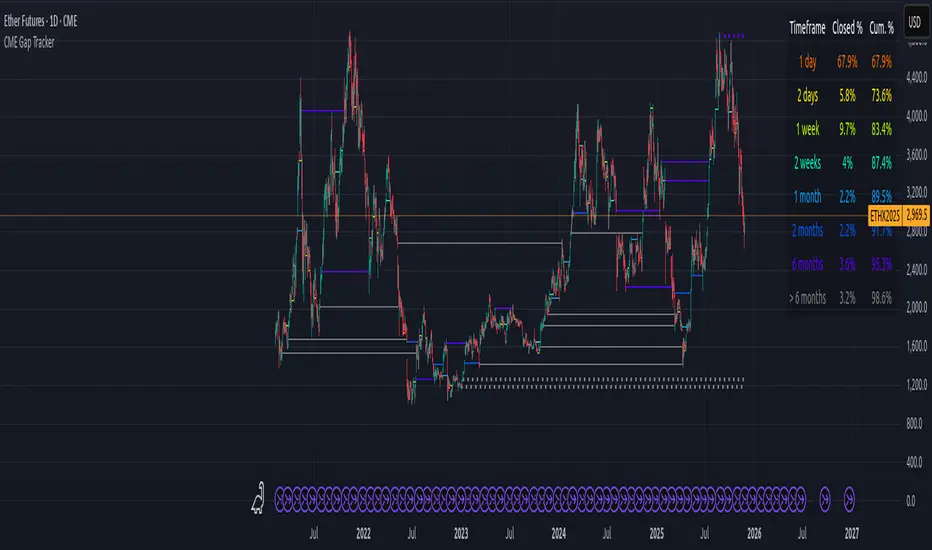
CME Gap Tracker + Live StatisticsThis script automatically finds the gaps inherent in the time data of any given chart, and displays them in color-coated buckets of how long it takes for the close of the gap to get filled. Add it on any CME Futures chart on the daily, and it will find all the weekend gaps. Set your period to an hour, and it will find the intraday gaps. Also displays a statistical calculation for each bucket.
Larry Williams COT Analysis Enhanced [tradeviZion]Larry Williams COT Analysis Enhanced - Complete Description
📖 Introduction
Welcome to the Larry Williams COT Analysis Enhanced indicator. This comprehensive description explains every setting, feature, and capability of this advanced Commitments of Traders (COT) analysis tool.
This indicator implements Larry Williams' professional COT analysis methodology with enhanced features including statistical validation, combination analysis, and adaptive signal generation.
---
🎯 Quick Start
Add the indicator to your chart
The script will automatically detect your symbol's CFTC code and asset type
Review the main COT analysis table (displayed by default)
Customize settings based on your trading style
Review the Trading Edge & Signals section for signal information
---
⚙️ Settings Groups Overview
The indicator is organized into 9 logical groups of settings:
1. Core COT Settings - Data source and report configuration
2. Analysis Parameters - Calculation methods and lookback periods
3. Signal Generation - Buy/sell signals and trend weighting
4. Plot Display Settings - Visual customization of chart lines
5. Smoothing Settings - Data smoothing options
6. COT Proximity Index Settings - Price-based proxy indicator configuration
7. Common Table Settings - Shared table appearance
8. Main Table Display Settings - Main analysis table customization
9. Historical Comparison Settings - Historical data table configuration
---
📋 Group 1: Core COT Settings
COT Report Type
Options: Legacy | Disaggregated | Financial
What it is: Selects the type of COT report data to analyze.
Legacy - Traditional COT report format. Recommended for most users. Uses "Commercial Positions" and "Noncommercial Positions" metrics. Shows Commercial, Non-Commercial, and Small Speculator positions in the classic format.
Commercials: "Commercial Positions"
Speculators: "Noncommercial Positions"
Small Specs: "Nonreportable Positions"
Disaggregated - Separates managed money from other speculators. Uses different metrics than Legacy format.
Commercials: "Producer Merchant Positions"
Speculators: "Managed Money Positions"
Small Specs: "Nonreportable Positions"
Important: When using Disaggregated report type, the table will still show "Non-Comm" as the label, but the data displayed is actually " Managed Money Positions " (hedge funds and CTAs). The underlying data changes based on your report type selection, even though the table label remains "Non-Comm" for consistency.
Where you'll see this data:
📊 Current Positions section - The "Non-Comm" row shows Managed Money long, short, and net positions
📊 Open Interest Analysis section - "Non-Comm" net changes reflect Managed Money position changes
📈 Analysis section - "Non-Comm" percentile and LW Index values are calculated from Managed Money positions
Chart plots - The blue "Non-Commercial" line shows Managed Money net positions
Useful when you want to analyze hedge funds (Managed Money) separately from other large speculators. The "Commercial" row will show " Producer Merchant Positions " instead of general "Commercial Positions".
Financial - Designed for financial instruments (currencies, bonds, stock indices). Uses financial-specific metrics.
Commercials: "Dealer Positions"
Speculators: "Leveraged Funds Positions"
Small Specs: "Nonreportable Positions"
Important: When using Financial report type, the table will still show "Commercial" and "Non-Comm" as labels, but the data displayed is actually " Dealer Positions " (commercials) and " Leveraged Funds Positions " (speculators). The underlying data changes based on your report type selection.
Where you'll see this data:
📊 Current Positions section - "Commercial" row shows Dealer long/short/net, "Non-Comm" row shows Leveraged Funds positions
📊 Open Interest Analysis section - Net changes reflect Dealer and Leveraged Funds position changes
📈 Analysis section - Percentile and LW Index values are calculated from Dealer and Leveraged Funds positions
Chart plots - Lines show Dealer and Leveraged Funds net positions
Use this for currency futures, bond futures, and stock index futures.
Trading Use: Most traders use Legacy as it provides the most comprehensive view and works with all asset types. Switch to Disaggregated if you want to analyze managed money positions separately. Use Financial specifically for financial instruments (currencies, bonds, stock indices).
---
Include Options Data
Default: Off (false)
What it is: Toggles whether to include options positions in addition to futures positions.
Trading Use: Larry Williams observed no significant difference in COT analysis when including options data. Keep this disabled unless you specifically need options data. Most traders leave it off for cleaner analysis.
---
Auto-detect CFTC Code
Default: On (true)
What it is: Automatically finds the correct CFTC code for your symbol.
Trading Use: Keep this enabled unless you need a specific CFTC code. The script automatically detects codes for:
- Currency futures: CME:6E1! , CME:6B1! , CME:6J1!
- Stock index futures: CME_MINI:ES1! , CBOT_MINI:YM1! , CME_MINI:NQ1!
- Commodities: NYMEX:CL1! , COMEX:GC1! , CBOT:ZC1!
- And many more
Only disable if you're analyzing a symbol that requires a specific CFTC code not in the auto-detection database.
---
Manual CFTC Code
Default: Empty
What it is: Enter a specific CFTC code manually (e.g. for E-mini S&P 500). "13874+"
Trading Use: Only used when Auto-detect CFTC Code is disabled. Most users never need this setting.
---
📊 Group 2: Analysis Parameters
Display Mode
Options: COT Report | COT Index | COT Proximity Index
What it is: Controls what data is displayed on the chart and in the table.
COT Report - Shows raw position data (Long, Short, Net positions) plus analysis. Best for detailed analysis. Displays Commercial, Non-Commercial, Small Speculator, and Open Interest lines.
COT Index - Shows index values based on your selected Analysis Method (Percentile or LW Index). Best for quick sentiment analysis. Displays index lines for Commercial, Non-Commercial, Small Speculator, and Open Interest. Percentile can exceed 0-100% for extremes, LW Index stays 0-100%.
Percentile can exceed 0-100% for extremes
LW Index stays 0-100%
COT Proximity Index - Shows a price-based proxy indicator. Useful when COT data is delayed or unavailable. Calculates sentiment based on price action patterns.
Trading Use:
- Use COT Report for comprehensive analysis
- Use COT Index when you want to focus on extreme sentiment levels
- Use COT Proximity Index as a backup when COT data is delayed or unavailable.
---
Analysis Method
Options: Percentile | LW Index
What it is: Selects the calculation method for position rankings.
Percentile - Professional approach. Excludes current bar from range calculation. Can show extremes (>100% or <0%) when today's value breaks historical range. More sensitive to recent extremes.
LW Index - Original Larry Williams method. Includes current bar in range, always 0-100%. Traditional approach.
Trading Use:
Percentile - Better for catching new extremes and recent market shifts
LW Index - Better for traditional Larry Williams analysis
Most traders prefer Percentile for its ability to show when positions break historical ranges.
---
Lookback Mode
Options: Auto | Manual
What it is: Controls how the historical lookback period is determined.
Auto - Automatically sets lookback period based on detected asset type
Manual - Choose your own lookback period
Trading Use: Use Auto unless you have a specific reason to customize. The script automatically sets optimal periods:
Currencies: 26 weeks
Metals: 13 weeks
Grains: 26 weeks
Stocks/Indices: 13 weeks
Bonds: 52 weeks
Energies: 13 weeks
---
Manual Lookback Period
Options: 1 Month | 3 Months | 6 Months | 1 Year | 3 Years | Asset-specific presets | Manual
What it is: How far back to look for historical comparison. Only used when Lookback Mode is set to Manual .
---
Manual Lookback Weeks
Default: 18 weeks | Range: 1-500
What it is: Exact number of weeks to look back. Only used when Manual Lookback Period is set to Manual .
Trading Use: Set a custom period if you want precise control. 18 weeks = approximately one quarter (3 months).
---
🎯 Group 3: Signal Generation
Show Signal Arrows
Default: Off (false)
What it is: Displays buy/sell arrows on the chart when extreme positions are detected.
Trading Use: Enable to get visual alerts for signals. Signals use strict multi-factor conditions requiring:
- Commercial extreme positioning
- Speculator positioning alignment
- Open Interest confirmation
- Trend consistency
- And more...
---
Show Background Colors
Default: Off (false)
What it is: Colors the chart background during extreme market conditions.
Trading Use: Enable for visual market state awareness:
- Strong signals = Darker background colors
- Moderate signals = Lighter background colors
- Green background = Bullish extreme
- Red background = Bearish extreme
Useful for quick visual assessment of market conditions.
---
Use Price Trend Weighting
Default: On (true)
What it is: Weights signals based on price trend alignment.
How it works:
Uptrend + Commercials long = Stronger bullish signal
Downtrend + Commercials short = Stronger bearish signal
Counter-trend signals = Harder to trigger (more conservative)
Trading Use: Keep enabled for more reliable signals. Commercials aligned with price trend are historically more accurate.
This feature makes signals easier to trigger when commercials align with the trend and harder when they're counter-trend.
---
Trend MA Period
Default: 40 | Range: 1-200
What it is: Moving average period for price trend detection.
How it works:
Price above MA with the MA rising = Uptrend
Price below MA with the MA declining = Downtrend
---
📈 Group 4: Plot Display Settings
Commercial Line Settings
Default Color: Red | Default Width: 2
What it is: Controls the Commercial traders net position line appearance.
Trading Use: Commercials are considered "smart money." Watch for:
Extreme long positions (high index ≥74%) = Heavy buyers = BULLISH signal
Extreme short positions (low index ≤26%) = Heavy sellers = BEARISH signal
Red is traditional for commercials. When Commercials are heavy buyers (high index), it's a bullish signal. When they're heavy sellers (low index), it's a bearish signal.
---
Non-Commercial Line Settings
Default Color: Blue | Default Width: 2
What it is: Controls the Non-Commercial (Large Speculators) net position line appearance.
Trading Use: Large speculators are often trend-followers. Watch for:
Extreme long = Potential top (contrarian sell signal)
Extreme short = Potential bottom (contrarian buy signal)
They're often wrong at extremes - use as contrarian indicator.
---
Small Speculator Line Settings
Default Color: Green | Default Width: 2
What it is: Controls the Small Speculators net position line appearance.
Trading Use: Small specs are typically wrong at extremes:
Extreme long = Potential top (sell signal)
Extreme short = Potential bottom (buy signal)
Exception: In Meats markets, small specs are accurate (like commercials).
---
Small Speculator Multiplier
Default: 5.0x | Range: 0.1-20.0
What it is: Multiplies Small Speculator PLOTTED values for visual comparison.
Important: This only affects the visual plot line, NOT calculations or table values. Raw values used in all calculations remain unchanged.
Trading Use: Small spec positions are often much smaller than commercials. Use multiplier (default 5.0x) to scale the line for easier visual comparison.
---
Open Interest Line Settings
Default Color: Black | Default Width: 1
What it is: Controls the Open Interest line appearance.
Trading Use: Open Interest shows market participation:
Rising OI = New money entering (confirms trend)
Falling OI = Money leaving (potential reversal)
Watch WHO is driving OI changes - This is critical
---
Scale Open Interest
Default: On (true)
What it is: Scales Open Interest values to fit chart range.
Important: Only affects plotted lines, not table values. Scaling changes based on lookback period:
- Shorter lookback = More compressed range
- Longer lookback = Wider range
Trading Use: Keep enabled for better visual comparison. Disable if you want absolute OI values.
---
Show Reference Lines
Default: Off (false)
What it is: Toggles the display of horizontal reference lines at 0%, 50%, and 100% levels on the chart.
What it shows:
Zero Line (0%) - Dotted gray line at 0% level
Midline (50%) - Solid gray line at 50% level
100 Line (100%) - Dotted gray line at 100% level
Trading Use: Enable when you want visual reference points for:
0% = Extreme bearish positioning
50% = Neutral/middle range
100% = Extreme bullish positioning
---
🔄 Group 5: Smoothing Settings
Smoothing Method
Options: None | SMA | EMA | WMA | RMA
What it is: Selects the moving average type for smoothing data.
None - Use raw data (no smoothing)
SMA - Simple Moving Average (equal weight to all periods)
EMA - Exponential Moving Average (more weight to recent data)
WMA - Weighted Moving Average (linear weighting)
RMA - Relative Moving Average (Wilder's smoothing)
Trading Use:
None - Best for catching extremes quickly
SMA - Most common, balanced smoothing
EMA - More responsive to recent changes
WMA/RMA - Advanced smoothing methods
Smoothing reduces noise but may delay signal detection. Use None for most responsive signals.
---
Smoothing Period
Default: 4 | Range: 2-20
What it is: Number of periods for the moving average smoothing.
Trading Use:
Shorter periods (2-5) = Less smoothing, more responsive
Longer periods (10-20) = More smoothing, less noise
Default 4 = Good balance
Only used when Smoothing Method is not None.
---
Smooth COT Report Plots
Default: Off (false)
What it is: Applies smoothing to COT Report plotted lines (Commercial, Non-Commercial, Small Speculators, Open Interest).
Trading Use: Enable if you want smoother chart lines. Note: Smoothing affects visual display but calculations use raw data unless Smooth COT Index Plots is also enabled.
---
Smooth COT Index Plots
Default: Off (false)
What it is: Applies smoothing to COT Index plotted lines.
Trading Use: Enable if you want smoother index lines. Important : When enabled, smoothed values are used in table displays and signal calculations. This affects the "user-facing" index values shown in the table and used for signals.
---
📊 Group 6: COT Proximity Index Settings
Proximity Length Mode
Options: Auto | Manual
What it is: Controls how the proximity index calculation period is determined.
Auto - Calculates length based on ZigZag patterns (dynamic)
Manual - Uses fixed length setting
Trading Use: Use Auto for adaptive calculation. Use Manual if you want consistent period regardless of market conditions.
---
Manual Proximity Length
Default: 8 bars | Range: 1+
What it is: Fixed number of bars for COT Proximity Index calculation. Only used when Proximity Length Mode is Manual .
Trading Use: Set based on your timeframe. 8 bars works well for weekly chart.
---
Heavy Buyers Level
Default: 74% | Range: 50-100
What it is: COT Index level above which commercials are considered heavy buyers (extreme long positioning).
Trading Use: This threshold is used for:
- Signal generation
- Market state calculation
- Entry level recommendations
Default 74% means commercials are "heavy buyers" when LW Index ≥ 74%.
---
Heavy Sellers Level
Default: 26% | Range: 0-50
What it is: COT Index level below which commercials are considered heavy sellers (extreme short positioning).
Trading Use: This threshold is used for:
- Signal generation
- Market state calculation
- Entry level recommendations
Default 26% means commercials are "heavy sellers" when LW Index ≤ 26%.
---
ZigZag Deviation
Default: 1.0% | Range: 1-100.0
What it is: Minimum price change (%) required to create a new ZigZag pivot point.
Trading Use:
Smaller values = More sensitive, more pivots
Larger values = Less sensitive, fewer pivots
Used for Auto proximity length calculation.
---
ZigZag Depth
Default: 1 | Range: 1+
What it is: Minimum number of bars between pivot points.
Trading Use: Higher values filter out minor pivots. Default 1 captures all significant pivots.
---
Extend ZigZag to Last Bar
Default: Off (false)
What it is: Draws ZigZag lines to the current bar (may show incomplete patterns).
Trading Use: Enable to see current ZigZag pattern, but be aware it may change as new bars form.
---
Show ZigZag Lines
Default: Off (false)
What it is: Displays ZigZag pivot lines on the chart for visual reference.
Trading Use: Enable to see the ZigZag pattern used for proximity index calculation. Useful for understanding how Auto mode works.
---
🎨 Group 7: Common Table Settings
Color Theme
Options: Dark | Light | Midnight Blue | Ocean Blue | Forest Green | Amber Gold | Slate Gray
What it is: Color scheme for both main and historical comparison tables.
Trading Use: Choose based on your preference:
Dark/Light - Classic themes
Midnight Blue - Professional dark theme
Ocean Blue - Calming blue tones
Forest Green - Natural green theme
Amber Gold - Warm gold tones
Slate Gray - Modern gray theme
Theme applies to both tables simultaneously for consistency.
---
📋 Group 8: Main Table Display Settings
Show COT Table
Default: On (true)
What it is: Toggles the main COT analysis table display.
Trading Use: Disable only if you want to use chart plots only. Most traders keep this enabled for comprehensive analysis.
---
Table Mode
Options: Full | Compact
What it is: Controls the detail level of the main table.
Full - Complete analysis table with all sections
Compact - Essential info only (mobile-friendly)
Trading Use:
Full - Desktop trading, comprehensive analysis
Compact - Mobile trading, quick reference
See "Table Modes Explained" section below for details.
---
Table Position
Options: Top Right | Top Left | Bottom Right | Bottom Left | Middle Right | Middle Left
What it is: Position of the main COT analysis table on the chart.
Trading Use: Choose based on your chart layout and preference. Top Right is default and works well for most traders.
---
Table Text Size
Options: Tiny | Small | Normal | Large
What it is: Size of text in the COT analysis table.
---
Section Visibility Controls
All default: On (true)
What it is: Individual toggles to show/hide specific table sections.
⚙️ Settings - Report Type, CFTC Code, Options setting
📊 Current Positions - Long, Short, Net positions for each group
📈 Analysis - LW Index, Percentile, Market State
🎯 Trading Edge & Signals - Current Signal, Entry Level, Best Setup
💡 Trading Tips - Context-aware trading insights
📈 Trend Analysis - Trend Direction, Strength, Cum Change, ROC, vs MA
🔄 Market Maker Activity - Spreading, Activity Level, Trading Edge
Trading Use: Customize your table to show only what you need:
Quick traders - Show only Trading Edge & Signals
Detailed analysis - Show all sections
Mobile users - Hide less critical sections
Each section can be toggled independently for maximum customization.
---
📊 Group 9: Historical Comparison Settings
Show Historical Comparisons
Default: On (true)
What it is: Toggles the historical comparison table display.
Trading Use: This table shows how current positions rank over different time periods (1M, 3M, 6M, 1Y, 3Y, All Time). Very useful for context.
---
Historical Table Mode
Options: Full | Compact
What it is: Controls the detail level of the historical comparison table.
Full - Complete historical comparison with all time periods (1M, 3M, 6M, 1Y, 3Y, All Time) and all COT groups
Compact - Essential periods only (1M, 3M, 6M, 1Y, All Time) showing Commercial % only
Trading Use:
- Full - Comprehensive historical analysis
- Compact - Quick reference, mobile-friendly
---
Table Position (Historical)
Options: Top Right | Top Left | Bottom Right | Bottom Left
What it is: Position of the historical comparison table on the chart.
---
Table Text Size (Historical)
Options: Tiny | Small | Normal | Large
What it is: Size of text in the historical comparison table.
---
Trading Days
Options: Weekdays | 24/7
What it is: How to calculate time periods for historical comparisons.
Weekdays - Calculate based on trading days only (5 days/week)
24/7 - Include all calendar days (7 days/week), Use for 24/7 markets like cryptocurrencies
Used for both main COT data and COT Proximity Index historical comparisons.
---
📊 Table Modes Explained
Full Mode - Main Table
The Full mode displays all available sections:
⚙️ Settings - Report type, CFTC code, options setting
📊 Current Positions - Long, Short, Net for Commercial, Non-Commercial, Small Speculators
📊 Open Interest Analysis - OI value, change, who's driving changes, concentration
📈 Analysis - Percentile ranks, LW Index values, Market State
🎯 Trading Edge & Signals - Current Signal, Entry Level, What to Watch, Best Setup
💡 Trading Tips - Context-aware insights
📈 Trend Analysis - Trend Direction, Strength, Consistency, Cumulative Change, ROC %, vs MA
🔄 Market Maker Activity - Spreading %, Activity Level, Interpretation, Trading Edge
Best for: Desktop trading, comprehensive analysis, detailed market assessment
---
📋 Understanding Each Table Section
This section explains what each part of the main table means and how to use it for trading decisions.
⚙️ Settings Section
Report Type - Shows which COT report format you're using (Legacy, Disaggregated, or Financial). Verify this matches your asset type.
Options - Indicates if options data is included ("Included") or excluded ("Excluded"). Most traders exclude options for cleaner analysis.
CFTC Code - Unique identifier for your futures contract. Shows "Auto" when automatically detected, or displays the manual code if set.
Trading Use: Always verify your CFTC code is correct. Wrong code = wrong data = wrong signals.
---
📊 Current Positions Section
Shows the actual position sizes for each trader group.
What Each Column Means:
Long - Total long contracts held by this group
Short - Total short contracts held by this group
Net - Net position (Long - Short). This is the key number.
How to Interpret:
Commercial Net Position:
- Negative (Net Short) = Commercials expect prices to fall
- Positive (Net Long) = Commercials expect prices to rise
- Commercials are "smart money" - their positioning often precedes major moves
Non-Commercial Net Position:
- Positive (Net Long) = Large speculators bullish
- Negative (Net Short) = Large speculators bearish
- Often trend-followers, can be caught at extremes
Small Spec Net Position:
- Positive (Net Long) = Small traders bullish
- Negative (Net Short) = Small traders bearish
- Often contrarian indicator - wrong at extremes
Trading Edge: Watch for extremes in Commercial net positions. When Commercials are heavy buyers (high index ≥74%), it's a bullish signal. When they're heavy sellers (low index ≤26%), it's a bearish signal.
---
📊 Open Interest Analysis Section
Open Interest - Total number of outstanding contracts. Shows market participation level.
Change - Week-over-week change in Open Interest. Rising OI = new money entering, Falling OI = money leaving.
Net Changes - Shows which group is driving Open Interest changes. This is Larry Williams' most important insight.
🎯 Critical Question: Who is Driving OI Changes?
EXTREMELY BULLISH SIGNAL (Very Rare - Pay Close Attention):
- Commercials driving OI increase + Commercials raising positions + Uptrend market
- Meaning: Smart money (commercials) accumulating long positions while market is rising
- Action: Extremely bullish - very rare setup, pay close attention to this signal
- This is the strongest bullish signal possible
BULLISH SIGNAL (Strong Buy):
- Commercials driving OI increase + Commercials net long
- Meaning: Smart money accumulating long positions
- Action: Strong bullish setup
BEARISH SIGNAL (Strong Sell - Market Topping):
- Commercials exiting + OI increasing due to Small Specs + Non-Commercials
- Meaning: Smart money leaving while speculative money entering
- Action: Market top forming - most likely scenario for bearish reversal
- This indicates speculative excess and potential market top
BEARISH SIGNAL (Speculative Excess):
- Small Specs + Non-Commercials driving OI increase + They are net long
- Meaning: Speculative excess, "dumb money" driving market
- Action: Bearish reversal likely
Trading Use:
- Rising OI = New money entering (confirms trend)
- Falling OI = Money leaving (potential reversal)
- Watch WHO is driving OI changes - This is critical
- When Commercials drive OI increases while raising positions in an uptrend = Extremely bullish and very rare - pay attention
- When Commercials exit while OI increases due to Small Specs and Non-Commercials = Market topping signal
Concentration - Shows how much of the market is controlled by the largest traders:
- Top 4 - Four largest traders' share of total OI
- Top 8 - Eight largest traders' share of total OI
Trading Use: High concentration (>30%) means fewer dominant players, potential for volatility. Low concentration means more distributed positions, healthier market.
---
📈 Analysis Section
Proximity Index (when in COT Proximity Index mode):
- Value: Current proximity index reading (0-100%)
- Length: Number of bars used in calculation
- Status: Heavy Buyers, Heavy Sellers, or Neutral
Analysis Method - Shows whether you're using Percentile or LW Index calculation.
Small Spec Mode - Shows how Small Speculators are interpreted:
- Contrarian (Traditional) - Small specs are wrong at extremes (default)
- Accurate (Meats) - Small specs are accurate like commercials (for Meats markets)
Market State - Overall market sentiment assessment:
- STRONG BULLISH - Multiple factors aligned bullish, strong buy signal
- MODERATE BULLISH - Several bullish factors, moderate buy signal
- LEANING BULLISH - Slight bullish bias, watch for confirmation
- NEUTRAL - Mixed signals, trade with existing trend
- LEANING BEARISH - Slight bearish bias, watch for confirmation
- MODERATE BEARISH - Several bearish factors, moderate sell signal
- STRONG BEARISH - Multiple factors aligned bearish, strong sell signal
Trading Use: Start your analysis here. Market State gives you the overall picture before diving into details.
---
🎯 Trading Edge & Signals Section
Current Signal - Shows which combination is active based on current positioning extremes and its expected accuracy percentage:
- Comm+Spec+OI - All three groups at extremes (highest accuracy)
- Comm+Spec - Commercials and specs at extremes (opposite extremes - Larry Williams' favorite)
- Comm+OI - Commercials and Open Interest at extremes (smart money + participation)
- Commercials - Only Commercials at extreme (smart money indicator)
- Wait - No extremes detected, wait for setup
Entry - Trading signal based on Commercial positioning:
- LONG - Commercials are heavy buyers (≥Heavy Buyers Level), bullish signal
- SHORT - Commercials are heavy sellers (≤Heavy Sellers Level), bearish signal
- Wait - Commercials neutral, no clear signal
Best Setup - Shows the historically highest accuracy combination found in the data:
- Comm+Spec+SmallSpec+OI - All four groups aligned (strongest signal)
- Comm+Spec+OI (All) - Commercials + Speculators + Open Interest aligned
- Comm+Spec+SmallSpec - Commercials + Speculators + Small Specs aligned
- Comm+Spec (Both) - Commercials + Speculators (opposite extremes - Larry Williams' favorite)
- Comm+OI (Both) - Commercials + Open Interest (participation confirms smart money)
- Comm+SmallSpec - Commercials + Small Specs (especially strong in Meats markets)
- Commercials Alone - Commercial positioning only (baseline - smart money indicator)
Trading Use: This is your action center . Focus on Entry signals when Market State confirms. Higher accuracy setups (shown in Best Setup) are more reliable.
---
💡 Trading Tips Section
Context-aware insights based on current market conditions.
What You'll See:
Commercial positioning assessment (extreme long/short, favorable/unfavorable)
Speculator positioning (contrarian support or warning)
Open Interest guidance (who's driving changes)
Trend assessment (aligning or conflicting)
Information about entry timing, position sizing, and confirmation needs
Trading Use: Review these tips when analyzing. They provide context-specific information tailored to current conditions.
---
📈 Trend Analysis Section
Trend Direction - Overall price trend:
- Bullish - Price trending up
- Bearish - Price trending down
- Mixed - No clear direction
Consistency - How stable the trend is:
- Consistent - Trend is stable and maintaining direction
- Mixed - Trend is unstable, direction changing
- Accelerating - Trend is gaining momentum
Strength - Trend intensity:
- Strong - Powerful trend
- Steady - Moderate trend
- Weak - Weak trend
This Week - Net position change this week (percentage).
Cumulative Change - Total net position change over different periods:
- 4W - 4-week cumulative change
- 13W - 13-week cumulative change (one quarter)
- 26W - 26-week cumulative change (half year)
ROC % - Rate of Change percentage over different periods. Shows momentum.
vs MA - Current net position compared to moving average:
- Positive = Above average (strong positioning)
- Negative = Below average (weak positioning)
Trading Use: Align COT signals with trend direction for higher accuracy. When COT signals align with price trend, signals are more reliable. Counter-trend signals require more confirmation.
---
🔄 Market Maker Activity Section
Total Spreading - Percentage of open interest in spread positions (simultaneous long and short in different months).
Percentile - Where current spreading level ranks historically. High percentile = unusual spreading activity.
13W Trend - 13-week trend in spreading activity (+ = increasing, - = decreasing).
Activity Level - Market maker activity intensity:
- High - Very active, expect volatility
- Moderate - Normal activity
- Low - Quiet, less volatility expected
vs 13W Avg - Current activity compared to 13-week average.
Trading Edge - Interpretation of market maker activity:
- High & Rising - Expect volatility, market makers hedging risk
- High & Stable - Active hedging, monitor for changes
- Low & Falling - Reduced activity, potential for directional moves
Trading Use: High market maker activity often precedes volatility. Use this to adjust position sizing and risk management. When spreading is high and rising, expect choppy conditions.
---
📋 Understanding Compact Mode Fields
The Compact mode provides essential information for quick trading decisions. Here's what each field means:
State
Shows the overall market sentiment based on combined COT analysis.
Possible Values:
- STRONG BULLISH - Multiple factors aligned bullish, strong buy signal
- MODERATE BULLISH - Several bullish factors, moderate buy signal
- LEANING BULLISH - Slight bullish bias, watch for confirmation
- NEUTRAL - Mixed signals, trade with existing trend
- LEANING BEARISH - Slight bearish bias, watch for confirmation
- MODERATE BEARISH - Several bearish factors, moderate sell signal
- STRONG BEARISH - Multiple factors aligned bearish, strong sell signal
Trading Use: Start your analysis here. Strong signals (STRONG BULLISH/BEARISH) indicate higher confidence setups. Neutral means trade with price trend.
---
Entry
Your actionable trading signal based on Commercial positioning.
Possible Values:
- LONG - Commercials are heavy buyers (≥Heavy Buyers Level), bullish signal
- SHORT - Commercials are heavy sellers (≤Heavy Sellers Level), bearish signal
- Wait - Commercials neutral, no clear signal
Trading Use: This is your go/no-go decision point. Only take trades when Entry shows LONG or SHORT. When Entry = Wait, stay on sidelines until clearer signal develops.
---
Comm Index
Commercial LW Index percentage showing where Commercial net position ranks historically.
Range: 0% to 100%
- 0-26% = Commercials heavy sellers (bearish positioning)
- 27-73% = Commercials neutral (no extreme)
- 74-100% = Commercials heavy buyers (bullish positioning)
Trading Use: Commercial extremes are most reliable. Values ≥74% (heavy buyers/extreme long) = BULLISH signal. Values ≤26% (heavy sellers/extreme short) = BEARISH signal. When Commercials are heavy buyers, it indicates bullish sentiment. When they're heavy sellers, it indicates bearish sentiment.
---
OI Status
Open Interest condition showing market participation level and trend.
Format: Status (Percentile %)
Examples:
- High (100.0%) - OI at extreme high, strong participation
- Moderate (50.0%) - OI at average level
- Low (10.0%) - OI at extreme low, weak participation
Trend Indicators:
- Rising - OI increasing (new money entering)
- Falling - OI decreasing (money leaving)
- Stable - OI unchanged
Trading Use: High OI with rising trend = strong market participation, confirms directional moves. Falling OI = watch for potential reversals. Low OI = reduced participation, potential for volatility.
---
Best Setup
Shows which combination of factors has the highest historical accuracy.
Format: Combination Name (Accuracy %)
Examples:
- Commercials Alone (75.3%) - Commercial positioning only
- Commercials + Speculators (68.2%) - Commercials and specs aligned
- Commercials + Open Interest (72.1%) - Commercials with OI confirmation
- Commercials + Speculators + OI (82.1%) - All factors aligned (strongest)
Trading Use: Higher accuracy values indicate signals with higher historical accuracy. When Best Setup shows "Commercials + Speculators + OI" with high accuracy, it indicates a combination with strong historical performance.
---
Trend
13-week cumulative trend direction based on net position changes.
Possible Values:
- Bullish - Net positions trending bullish over 13 weeks
- Bearish - Net positions trending bearish over 13 weeks
- Mixed - No clear directional trend
Trading Use: Align Entry signals with Trend for higher accuracy. When Entry = LONG and Trend = Bullish, signal is stronger. When Entry = LONG but Trend = Bearish, wait for price confirmation before entering. Counter-trend signals require more confirmation.
---
Full Mode - Historical Table
The Full historical mode shows:
All time periods: 1 Month, 3 Months, 6 Months, 1 Year, 3 Years, All Time
All COT groups: Commercial, Non-Commercial, Small Speculators, Open Interest
Complete header with asset type and lookback information
Best for: Comprehensive historical analysis, understanding long-term positioning
---
Compact Mode - Historical Table
The Compact historical mode shows:
Essential periods only: 1M, 3M, 6M, 1Y, All Time
Commercial % only (most important indicator)
Simplified header
Best for: Quick reference, mobile-friendly, focused analysis
---
🎯 How to Use Each Feature for Trading
Using Display Modes
COT Report Mode - Use for:
Understanding raw position sizes
Analyzing net position changes
Comparing absolute positions across groups
Detailed market structure analysis
COT Index Mode - Use for:
Quick sentiment assessment
Identifying extremes (Percentile can show >100% or <0%, LW Index shows 0-100%)
Comparing relative positioning
Signal generation
COT Proximity Index Mode - Use for:
When COT data is delayed
Real-time sentiment estimation
Price-action based analysis
---
Using Analysis Methods
Percentile Method - Use when:
You want to catch new extremes (>100% or <0%)
You need responsive signals
You're analyzing recent market regime changes
You want to use the professional approach (excludes current bar from range)
LW Index Method - Use when:
You want traditional Larry Williams analysis
You prefer stable, conservative signals
You're doing long-term analysis
You want always 0-100% range
---
Using Signal Generation
Enable Signal Arrows when:
You want visual alerts for high-quality setups
You're scanning multiple charts
You want to catch extreme positioning
Enable Background Colors when:
You want quick visual market state assessment
You're monitoring multiple timeframes
You want to see market conditions at a glance
Use Price Trend Weighting to:
Increase signal reliability
Align COT signals with price action
Filter counter-trend signals
---
Using Smoothing
No Smoothing - Best for:
Catching extremes quickly
Responsive signal generation
Active trading
With Smoothing - Best for:
Reducing noise
Trend identification
Swing trading
Remember: Smoothing affects visual display. Enable "Smooth COT Index Plots" if you want smoothed values in calculations.
---
Using Heavy Buyers/Sellers Levels
Default 74%/26% - Good starting point
Tighter levels (80%/20%) - More conservative, fewer signals
Wider levels (70%/30%) - More signals, less extreme
Trading Use: Adjust based on your risk tolerance and signal frequency preference.
---
Using Table Sections
Settings - Verify your configuration
Current Positions - Understand current market structure
Analysis - Identify extremes and market state
Trading Edge & Signals - Most important - Entry signals based on Commercial positioning
Trading Tips - Context-aware insights
Trend Analysis - Understand momentum and direction
Market Maker Activity - Assess market maker positioning
---
💡 Key Trading Concepts
Market State Interpretation
STRONG BULLISH - Multiple factors aligned bullish. Strong buy signal.
MODERATE BULLISH - Several bullish factors. Moderate buy signal.
LEANING BULLISH - Slight bullish bias. Watch for confirmation.
NEUTRAL - Mixed signals. Trade with existing trend.
LEANING BEARISH - Slight bearish bias. Watch for confirmation.
MODERATE BEARISH - Several bearish factors. Moderate sell signal.
STRONG BEARISH - Multiple factors aligned bearish. Strong sell signal.
---
Entry Level Signals
LONG - Commercials are heavy buyers (≥Heavy Buyers Level). Bullish signal.
SHORT - Commercials are heavy sellers (≤Heavy Sellers Level). Bearish signal.
Wait - Commercials neutral. No clear signal.
When Commercials are heavy buyers (high index), it indicates bullish sentiment. When they're heavy sellers (low index), it indicates bearish sentiment.
---
Best Setup Interpretation
The Best Setup shows the historically highest accuracy combination:
Commercials Alone - Commercial positioning is most reliable
Commercials + Speculators - Both groups aligned
Commercials + Open Interest - Commercials + OI confirmation
Commercials + Speculators + OI - All factors aligned (strongest)
Higher accuracy = More reliable signal. Use this to prioritize which signals to follow.
---
Open Interest Analysis
Critical Question: Who is driving Open Interest changes?
EXTREMELY BULLISH (Very Rare):
Commercials driving OI increase + Commercials raising positions + Uptrend = EXTREMELY BULLISH
This is very rare - pay close attention when this occurs
STRONG BULLISH:
Commercials driving OI increase + Commercials long = STRONG BULLISH
BEARISH (Market Topping):
Commercials exiting + OI increasing due to Small Specs + Non-Commercials = BEARISH (market topping)
Most likely scenario for bearish reversal - speculative excess
BEARISH (Speculative Excess):
Speculators driving OI increase + Speculators long = BEARISH (speculative excess)
TREND CONFIRMATION:
Rising OI = Confirms trend (new money entering)
Falling OI = Potential reversal (money leaving)
This is one of Larry Williams' most important insights. When Commercials drive OI increases while raising positions in an uptrend, it's extremely bullish and very rare - pay attention. When Commercials exit while Small Specs and Non-Commercials drive OI increases, the market is likely topping.
---
🚀 Practical Trading Workflow
Daily Analysis Routine
Check Market State - Overall assessment
Review Entry Level - Actionable signal
Check Best Setup - Signal reliability
Review Trading Tips - Context-aware insights
Analyze Trend Analysis - Momentum confirmation
Check Historical Comparison - Context over time
Verify Open Interest - Who's driving changes
---
Signal Confirmation Checklist
Before taking a trade based on COT signals:
✓ Market State shows clear bias (not Neutral)
✓ Entry Level matches Market State
✓ Best Setup shows high accuracy (>60%)
✓ Price trend aligns with signal (if using trend weighting)
✓ Open Interest confirms (rising for trend continuation, falling for reversal)
✓ Historical comparison shows extreme positioning
✓ Price action confirms (wait for price confirmation)
---
⚠️ Important Notes
COT data is weekly - Updates every Friday afternoon
Extremes can persist - Don't expect immediate reversals
Combine with price action - COT is one tool among many
Historical context matters - Consider market conditions
Meats markets are special - Small specs are accurate (like commercials)
Signals are rare - High-quality signals don't appear every week
---
This description covers all settings and features of the Larry Williams COT Analysis Enhanced indicator. Larry Williams recommends combining COT analysis with other indicators for setup signals: Williams Sentiment Index, Williams Valuation Index, Williams True Seasonal, Pinch and Paunch Signal, along with price action, technical analysis, and fundamental factors.
---
📖 Conclusion
The Larry Williams COT Analysis Enhanced indicator provides a sophisticated framework for understanding market sentiment through the lens of different participant groups. By combining mathematical analysis with behavioral insights, it displays COT positioning data, calculates index values, and generates signals based on extreme positioning.
Remember: This is a tool for analysis, not a crystal ball. Consider combining COT analysis with other Larry Williams indicators, price action, technical analysis, and fundamental factors.
Practice with the indicator, study historical signals, and develop your understanding of how different market participants behave. Signals with multiple factors aligned - Commercials at extremes, Open Interest changes driven by the right groups, and price action confirming the COT signals - have shown higher historical accuracy.
This description provides comprehensive documentation for the Larry Williams COT Analysis Enhanced indicator. For the most current data and analysis, always refer to the latest COT reports and market conditions.
---
Acknowledgment
This tool builds upon the foundational work of Larry Williams, who developed the Commitments of Traders (COT) analysis methodology and the principles for interpreting COT data. It also incorporates enhancements including statistical validation, combination analysis, adaptive signal generation, and comprehensive historical comparison features.
Note: Always practice proper risk management and thoroughly test the indicator to ensure it aligns with your trading strategy. Past performance is not indicative of future results.

[GetSparx] Nova Pro⚡ Nova Pro – Position Calculator
This indicator is a user-friendly TradingView indicator designed to help traders plan and visualize their entry and exit points, calculate position sizing, and instantly display key risk metrics. By simply entering three price levels (Entry, Take Profit and Stop Loss) along with a risk amount in USD, the indicator draws color-coded lines and labels on the chart, and generates a concise table with all computed values. This allows you to assess the risk-reward profile of any trade at a glance, without performing manual calculations.
⚙️ How It Works
When the indicator is added to the chart it will ask to specify the price inputs and the risk amount in USD.
Price Inputs (Entry, TP, SL)
• You specify three price levels: the entry price, the profit target (Take Profit) and the loss threshold (Stop Loss).
• Inputs use TradingView’s native price-picker fields. Any change is immediately reflected on the chart.
Visual Display
• Each level is plotted as a line stretching into the future for enough room.
• Labels on the right show the exact price, color-coded: orange for Entry, green for TP and red for SL.
• Previous lines and labels are automatically removed when parameters change, ensuring the chart remains clean.
Risk Calculations
• The entered risk amount (in USD) is combined with the distance between Entry and SL to compute the optimal number of units (Qty) to trade.
• The script automatically detects whether it’s a long or short trade based on the relative positions of Entry and TP.
• Note that the risk and reward calculations do not factor in exchange fees, slippage, funding rates or any other trading costs. Actual profit and loss may differ once transaction fees and market execution variances are applied, so be sure to adjust your position sizing and expectations accordingly.
🎯 What You Can Do With It
• Consistent Position Sizing
Automate your position size so you consistently risk the same dollar amount, regardless of price volatility or stop distance.
• Clear Risk Management
Instantly view your Reward-to-Risk ratio, potential profit in USD and exact risk amount, so you make well-informed decisions.
• Rapid Scenario Analysis
Adjust TP, SL or Entry on the fly to see how each change affects your potential profit, loss and RR ratio.
• Publication-Ready Charts
The visual elements and integrated table are optimized for TradingView publications, giving your analysis a professional, polished look.
📊 Explanation of Table Values
• Entry
Calculation: rounded to the nearest tick of your entered entry price.
Marks the exact level at which you initiate the trade and serves as the reference point for all further risk and reward calculations.
• Quantity (Qty)
Calculation: Risk USD ÷ (Entry − Stop Loss).
Determines how many units, contracts or shares to trade so that a stop-out at your SL equals exactly your predefined dollar risk, resulting in consistent per-trade exposure.
• Risk to Reward (RR)
Calculation: (Take Profit − Entry) ÷ (Entry − Stop Loss).
Expresses how many dollars of potential profit you target for each dollar you risk. Values above 1 mean the reward exceeds the risk, guiding you to favorable setups.
• Take Profit (TP)
Calculation: rounded to the nearest tick of your entered take-profit price.
Your target exit level for booking gains, highlighted in green on the chart. Shows where you plan to capture profits if the market moves in your favor.
• Profit
Calculation: Qty × (Take Profit − Entry).
Gives the absolute potential gain in USD if price reaches your TP. Useful for comparing total return across different instruments or setups.
• Stop Loss (SL)
Calculation: rounded to the nearest tick of your entered stop-loss price.
The level at which your trade is automatically closed to cap losses, highlighted in red on the chart. Ensures you never lose more than your defined risk amount.
• Risk
Calculation: equals the entered Risk USD.
The maximum dollar amount you’re willing to lose on this trade. Acts as the upper boundary for your exposure, keeping your position sizing disciplined.
📝 Examples
• Long Example 1: Bitcoin/USD
Entry: $11851.1
Take Profit: $123853.9
Stop Loss: $115467.7
Risk USD: $500
The Risk to Reward ratio results in 2.25, which means the reward exceeds the risk.
For each dollar you risk, this setup has potential gains of 2.25 dollars.
• Long Example 2: Algorand/USD
Entry: $0.2919
Take Profit: $0.3491
Stop Loss: $0.2655
Risk USD: $1000
The Risk to Reward ratio on this trade results in 2.17 and has a potential profit target of $2166.67. With a risk of $1000 USD the table conveniently shows a quantity of 37878 ALGO is needed for the trade.
• Short Example 1: Forex EUR/USD
Entry: $1.16666
Take Profit: $1.15459
Stop Loss: $1.17374
Risk USD: $200
With a risk of $200 USD and a RR of 2.17, this example shows how a short trade can be accomplished on EUR/USD.
• Short Example 2: Gold
Entry: $3366.29
Take Profit: $3272.01
Stop Loss: $3386.87
Risk USD: $1500
Within this short setup a risk of $1500 USD is used, which results in a RR of 4.58. The potential profit for this trade is $6871.72.
⚠ Disclaimer
This tool is for educational and analytical use only. It does not provide financial advice or trading signals. Always use proper risk management and do your own due diligence.

OTT Volatility [RunRox]📊 OTT Volatility is an indicator developed by the RunRox team to pinpoint the most optimal time to trade across different markets.
OTT stands for Optimal Trade Time Volatility and is designed primarily for markets without a fixed trading session, such as cryptocurrencies that trade 24/7. At the same time, it works equally well on any other market.
🔶 The concept is straightforward. The indicator takes a specified number of historical periods (Samples) and statistically evaluates which hours of the day or which days show the highest volatility for the selected asset.
As a result, it highlights time windows with elevated volatility where traders can focus on searching for trade setups and building positions.
🔶 As the core volatility metric, the indicator uses ATR (Average True Range) to measure intraday volatility. Then it calculates the average ATR value over the last N Samples, creating a statistically stable estimate of typical volatility for the selected asset.
🔶 Statistically, during these highlighted periods the market shows higher-than-average volatility.
This means that in these time windows price is more likely to be subject to stronger moves and potential manipulation, making them attractive for active trade execution and position management.
⚠️ However, historical behavior does not guarantee future results.
These periods should be treated only as zones where volatility has a higher probability of being above normal, not as a promise of movement.
As shown in the screenshot above, the indicator also projects potential future volatility based on historical data. This helps you better plan your trading hours and align your activity with periods where volatility is statistically expected to be higher or lower.
🔶 Current Volatility – as shown in the screenshot above, you can also monitor the real-time volatility of the market without any statistical averaging.
On top of that, you can overlay the current volatility on top of the statistical volatility levels, which makes it easy to see whether the market is now trading in a high- or low-volatility regime relative to its usual behavior.
4 display modes – you can choose any visualization style that fits your trading workflow:
Absolute – displays the raw volatility values.
Relative – shows volatility relative to its typical levels.
Average Centered – centers volatility around its average value.
Trim Low Value – filters out low-volatility noise and highlights only more significant moves.
This indicator helps you define the most effective trading hours on any market by relying on historical volatility statistics.
Use it to quickly see when your market tends to be more active and to structure your trading sessions around those periods.
✅ We hope this tool becomes a useful part of your trading toolkit and helps you improve the quality of your decisions and timing.

BTST Stats BTST Statistical Edge Analyzer — VCR · Volume · SMA · RSI Filtered
This indicator isn’t a trading signal generator.
It’s a research framework designed to answer a simple but valuable question:
“Does Buy-Today-Sell-Tomorrow (BTST) have statistical edge under specific market conditions?”
Most traders assume BTST works because they feel markets gap.
This script measures whether that belief holds true — and under what filters.
🔍 What the Indicator Does
For each bar, the script simulates a BTST trade:
Entry: previous bar’s close
Exit: current bar’s open
Result: Open(next day) − Close(previous day)
But a BTST trade is only counted if the entry bar satisfies the filter logic.
🎯 Entry Filters You Can Tune
A trade is included only if ALL activated conditions are satisfied:
Filter Rule
VCR Filter Candle volatility ratio must exceed threshold: `(High−Low) /
Volume Filter Volume must be greater than n × AverageVolume
SMA Trend Filter (Optional) Close must be above a user-selected SMA length
RSI Condition (Optional) RSI must be between a user-defined min/max band
This allows testing BTST under different volatility, trend, and momentum conditions.
📊 What the Table Shows
For all qualifying trades inside the chosen lookback window, the indicator displays:
Metric Meaning
Profitable Trades Count of BTST trades with positive overnight return
Losing Trades Count of negative overnight returns
Avg Profit Average upside gain on winner trades
Avg Loss Average downside loss on losing trades
Avg Net per Trade Overall expectancy across all trades
Avg High After Entry Average maximum price movement above entry (potential upside)
Avg Low After Entry Average price movement against the entry (risk exposure)
Winner-Only High/Low Stats How far good trades move and how much heat they take
Loser-Only High/Low Stats How bad trades behave, including early fake-outs
Together, these reveal:
Opportunity potential
Risk exposure
Whether trades behave cleanly or chaotically
Whether exits are leaving money on the table
🧠 Why This Matters
BTST edges change drastically across:
Market regimes
Trend direction
Volatility clusters
Earnings cycles
Volume surges
This tool helps identify when BTST should be traded — and when it should be avoided entirely.
Rather than guessing, traders can:
Validate if their BTST assumptions hold,
Apply filters until the expectancy improves,
Rank symbols and conditions where the system performs best.
🚫 Not a Buy/Sell Indicator
This script does not place arrows, signals, alerts, or entries.
It exists for analysis and system development, not live execution.
Use it to:
Build ideas
Validate hypotheses
Compare symbols
Optimize BTST frameworks
Decide if BTST belongs in your playbook — or in the trash
🔧 Who This Is For
✔ System traders
✔ Quant-minded traders
✔ Options/Index traders who rely on gaps
✔ Swing traders testing overnight holds
✔ Developers building automated BTST logic
Final Thought
BTST isn’t magic — it’s just a behavior pattern.
Some markets reward it.
Some punish it.
Some reward it only under the right volatility and volume conditions.
This tool tells you which is which.

BTC ETF Flow Monitor🚀 Bitcoin ETF Flow Monitor - Track Institutional Money Flows
Monitor real-time dollar flows across major Bitcoin ETFs with this professional-grade indicator inspired by Dune Analytics. Perfect for tracking institutional sentiment and Bitcoin adoption trends.
📊 Key Features: • Real Dollar Flows : Display actual estimated flows in millions USD, not abstract indices
• 5 Major ETFs : IBIT (BlackRock), FBTC (Fidelity), ARKB (ARK), BITB (Bitwise), GBTC (Grayscale)
• Dune Analytics Style : Clean, professional visualization with meaningful thresholds
• Smart Alerts : Get notified of significant flow changes and BTC price divergences
• Enhanced Summary Table : Live stats including total flows, trends, and market sentiment
💡 How It Works: Combines volume, price action, and momentum to estimate institutional dollar flows. Positive values = inflows (buying pressure), negative values = outflows (selling pressure). Scale shows millions of USD for easy interpretation.
🎯 Perfect For:
- Tracking institutional Bitcoin adoption
- Identifying accumulation/distribution phases
- Spotting divergences between ETF flows and BTC price
- Understanding market sentiment shifts
⚡ Professional Grade: Built with advanced Pine Script techniques, optimized performance, and real-world trading applications in mind.

Trend Continuation [OmegaTools]Trend Continuation is a trend-following and trend-continuation tool designed to highlight high-probability pullbacks within an existing directional bias. It helps discretionary and systematic traders visually isolate “continuation zones” where a retracement is more likely to resolve in favor of the prevailing trend rather than trigger a full reversal.
1. Concept and Objective
The indicator combines two key components:
1. A trend bias engine (based either on a Rolling VWAP regime or on swing market structure).
2. A pullback pressure model, which quantifies how deep and “aggressive” the recent retracement has been relative to the trend.
The goal is to identify moments where the market pulls back against the trend, builds enough “reversal pressure,” and then shows signs that the trend is likely to **continue** rather than flip. When specific conditions are met, the indicator highlights bars and plots reference levels that can be used as potential continuation zones, filters, or confluence areas in a broader trading plan.
2. Trend Bias Modes
The primary trend direction is defined through the `Trend Mode` input:
* **RVWAP Mode (default)**
The script computes two rolling volume-weighted average prices over different lengths:
* A **shorter-term rolling VWAP**
* A **longer-term rolling VWAP**
When the shorter RVWAP is above the longer one, the bias is set to **bullish (+1)**. When it is below, the bias is **bearish (-1)**.
This creates a smooth, volume-weighted trend definition that tends to adapt to shifting regimes and filters out minor noise.
* **Market Structure Mode**
In this mode, trend bias is derived from **pivot highs and lows**:
* When price breaks above a recent pivot high, the bias flips to **bullish (+1)**.
* When price breaks below a recent pivot low, the bias flips to **bearish (-1)**.
This approach is more structurally oriented and reacts to significant swing breaks rather than just moving-average style relationships.
If no clear condition is met, the internal bias can temporarily be neutral, though the main design assumes working with clearly bullish or bearish environments.
3. Pullback and Reversal Pressure Logic
Once the trend bias is defined, the indicator measures **pullback intensity** against that trend:
* A **lookback window (“Pullback Length”)** scans recent highs and lows:
* In an uptrend, it tracks the **highest high** over the window and measures how far the current low pulls back from that high.
* In a downtrend, it tracks the **lowest low** and measures how far the current high bounces up from that low.
* This distance is converted into a **“reversal pressure” value**:
* In a bullish bias, deeper pullbacks (lower lows relative to the recent high) indicate stronger counter-trend pressure.
* In a bearish bias, stronger rallies (higher highs relative to the recent low) indicate stronger counter-trend pressure.
The raw reversal pressure is then smoothed with a long-term moving average to separate normal retracements from **statistically significant extremes**.
4. Thresholds and Histogram Coloring
To avoid reacting to every minor pullback, the indicator builds a **dynamic threshold** using a combination of:
* Long-term averages of reversal pressure.
* Standard deviation of reversal pressure.
* High-percentile values of reversal behavior over different sample sizes.
From this, a **threshold line** is derived, and the script then compares the current reversal pressure to this adaptive level:
* The **Reversal Histogram** (column plot) represents the excess reversal pressure above its own long-term average.
* When:
* There is a valid bullish or bearish bias, and
* The histogram is above the dynamic threshold,
the bars of the histogram are **colored**:
* Blue (or a similar “positive” color) in bullish bias.
* Red/pink (or a similar “negative” color) in bearish bias.
* When reversal pressure is below threshold or bias is not relevant, the histogram remains **neutral gray**.
These colored histogram segments represent **“high-tension” pullback states**, where counter-trend pressure has reached an extreme that, historically, often resolves with the original trend continuing rather than fully reversing.
5. Continuation Level and Bar Coloring on Price Chart
To connect the oscillator logic back to the chart:
* A **continuation reference level** is computed on the price series:
* In an uptrend, this is derived by subtracting the threshold from recent highs.
* In a downtrend, it is derived by adding the threshold to recent lows.
* This level is plotted as a **line on the price chart** (only when the trend bias is stable), acting as a visual guide for:
* Potential continuation zones,
* Possible stop-placement or invalidation areas,
* Or filters for entries/exits.
The bars are then **colored** when price crosses or interacts with these levels in the direction of the trend:
* In a bullish bias, bars closing below the continuation level can be highlighted as potential **deep pullback/continuation opportunities** or as warning signals, depending on the user’s playbook.
* In a bearish bias, bars closing above the continuation level are similarly highlighted.
This makes it easy to see where the oscillator’s “extreme pullback” conditions align with structural movements on the actual price bars.
6. Embedded Win-Rate Estimation (WR Table)
The script also includes an internal **win-rate style metric (WR%)** displayed in a small table on the chart:
* It tracks occurrences where:
* A valid bullish or bearish bias is present, and
* The Reversal Histogram is **above the threshold** (i.e., histogram is colored).
* It then approximates the **probability that the trend bias does not change** following such high-pressure pullback events.
* The WR value is shown as a percentage and represents, in essence, the **historical trend-continuation rate** under these specific conditions over the most recent sample of events.
This is not a formal statistical test and does not guarantee future performance, but it provides a quick visual indication of how often these continuation setups have led to **trend persistence** in the recent past.
7. How to Use in Practice
Typical applications include:
Trend-following entries on pullbacks
Identify the main trend using either RVWAP or Market Structure mode.
Wait for a colored histogram bar (reversal pressure above threshold).
Use the continuation reference line and bar coloring on the price chart to refine entry zones or invalidation levels.
Filtering signals from other systems
Run the indicator in the background to confirm trend continuation conditions before taking signals from another strategy (e.g., breakouts or momentum entries).
Only act on long signals when the bias is bullish and a high-pressure pullback has recently occurred; similarly for short signals in bearish conditions.
Risk management and trend monitoring
Monitor when reversal pressure is building against your current position.
Use shifts in bias combined with high reversal pressure to re-evaluate or scale out of trend-following trades.
Recommended steps:
1. Choose your Trend Mode:
- RVWAP for smoother, regime-style trend detection.
- Market Structure for swing-based structural changes.
2. Adjust Trend Length and Pullback Length to match your timeframe (shorter for intraday, longer for swing/position trading).
3. Observe where histogram colors appear and how price reacts around the continuation line and highlighted bars.
4. Integrate these signals into a pre-defined trading plan with clear entry, exit, and risk rules.
8. Limitations and Disclaimer
* This tool is a **technical analysis aid**, not a complete trading system.
* Past behavior of trend continuation or reversal pressure does **not** guarantee future results.
* The embedded WR metric is a **descriptive statistic** based on recent historical conditions only; it is not a promise of performance or a robust statistical forecast.
* All parameters (lengths, thresholds, modes) are user-configurable and should be **tested and validated** on your own data, instruments, and timeframes before any live use.
Disclaimer
This indicator is provided for informational and educational purposes only and does not constitute financial, investment, or trading advice. Trading and investing in financial markets involve substantial risk, including the possible loss of all capital. You are solely responsible for your own trading decisions and for evaluating all information provided by this tool. OmegaTools and the author of this script expressly disclaim any liability for any direct or indirect loss resulting from the use of this indicator. Always consult with a qualified financial professional before making any investment decisions.

Seasonality Calculation Tool by Luis TrompeterThe Seasonality Calculation Tool is designed to analyze and evaluate the strength of any seasonal pattern detected by the Seasonality Indicator.
While the Seasonality Indicator displays the historical seasonal curve, this tool goes one step further by examining how reliable and consistent that curve truly is.
The tool checks whether a seasonal pattern is strong, distorted by a few outlier years, or statistically meaningful. It calculates the average return within the selected seasonal window and highlights how accurate or robust the pattern has been over the evaluated period.
To support manual confirmation and deeper analysis, the tool also visualizes the seasonal windows directly on the chart. This allows traders to review past occurrences and backtest the pattern themselves to validate the quality of the signal.
The Seasonality Calculation Tool is an ideal complement to the main Seasonality Indicator, helping traders identify high-quality, data-driven seasonal tendencies and avoid misleading or weak seasonal patterns.
Usage
This script is intended to be used exclusively on the daily timeframe, as all calculations rely on daily candle data.
The settings are intuitive and easy to adjust, allowing users to quickly evaluate any seasonal window displayed by the Seasonality Indicator.

Auto Seasonality Scanner by Luis TrompeterThe Auto Seasonality Scanner automatically detects seasonal patterns by scanning a user-defined number of past years (e.g., the last 10 years).
Based on this historical window, the indicator identifies the strongest seasonal tendency for the currently selected date range.
The scanner evaluates all valid seasonal windows using two filters:
• Hit Rate – the percentage of profitable years
• Average Return – the highest mean performance across the analyzed period
The best-scoring seasonal setup is displayed directly on the chart, including the exact start and end dates of the identified pattern for the chosen time range.
Users can define the period they want to analyze, and the indicator will automatically determine which seasonal window performed best over the selected history.
Recommended Settings (Standard Use)
For optimal and consistent results, the following settings are recommended:
• Search Window: 20–30
• Minimum Length: 5
• Time Period: from 2015 onward
• US Election Cycle: All Years
These settings provide a balanced and reliable baseline to detect meaningful seasonal tendencies across markets.
This indicator helps traders understand when recurring seasonal patterns typically occur and how they may align with ongoing market conditions.
Timeframe Requirement
This indicator is intended to be used exclusively on the daily timeframe, as all calculations are based on daily candles.
Using it on lower timeframes may result in inaccurate or misleading seasonal readings.

BTC -50% Crash to Recovery ZoneGeneral Overview This is a macro-analysis tool designed to visualize the true duration of Bitcoin’s "Suffering & Recovery Cycles." Unlike standard oscillators that only signal oversold conditions, this script highlights the entire timeline required for the market to flush out leverage and return to All-Time Highs (ATH).
Operational Logic The algorithm tracks Bitcoin’s historical All-Time High (ATH).
The Trigger: It activates automatically when the price drops 50% below the last recorded ATH.
The "Recovery Zone": Once triggered, the chart background turns red (indicating a "Drawdown" state). This zone remains active persistently, even during intermediate relief rallies.
The Reset: The zone deactivates only when the price breaks above the previous ATH, marking the official start of a new Price Discovery phase.
How to Read It
Red Background: We are officially in a Bear Market or Recovery Phase. The asset is technically "underwater." For the long-term investor with a low time preference, this visually defines the accumulation window.
Red Horizontal Line: Indicates the "Target." This is the exact price level of the old ATH that Bitcoin must reclaim to close the bearish cycle.
No Background Color: We are in Price Discovery. The market is healthy and pushing for new highs.
The Financial Lesson This indicator visually demonstrates a fundamental market truth: "Price takes the elevator down, but takes the stairs up." It shows that after a halving of value (-50%), Bitcoin may take months or years to recover previous levels, helping investors filter out the noise of short-term pumps that fail to break the macro-bearish structure.

RSI Driven ATR Trend [NeuraAlgo]
RSI Driven ATR Trend
Dynamic Trend Detection and Strength Analysis
Unlock the market’s hidden rhythm with the RSI Driven ATR Trend , a sophisticated tool designed to measure trend direction and strength using a combination of RSI momentum and ATR-based volatility . This indicator provides real-time insights into bullish and bearish phases, helping traders identify potential turning points and optimize entry and exit decisions.
1.Core In Logic:
Dynamically calculates trend levels based on RSI and ATR interactions.
Highlights trend direction with intuitive color coding: green for bullish, red for bearish.
Displays trend strength as a percentage to quantify momentum intensity.
Automatic visual cues for potential trend reversals with “Turn Up” and “Turn Down” labels.
Advanced smoothing and dynamic gating ensure responsive yet stable trend detection.
Compatible with all timeframes and instruments.
2.Inputs Explained:
Rsi Factor: Adjusts the sensitivity of the RSI in trend calculation. Higher values make the trend detection more responsive to momentum changes.
Multiplier: Multiplies the effect of Rsi Factor to fine-tune trend responsiveness.
Bar Back: Number of bars used for peak and dip calculations, determining how far back the indicator looks for trend changes.
Period: Lookback period used in trend gating and ATR calculations.
Source: Price source for calculations (default is close).
Main Colors: Customize bullish and bearish trend colors.
3.How it Works:
The indicator calculates RSI values and ATR-based dynamic ranges to determine upper and lower trend levels.
Trend direction is determined by price crossing above (bullish) or below (bearish) the dynamic trend line.
Trend strength is expressed as a percentage relative to the trend line, helping you assess momentum intensity.
Visual cues like "Turn Up" and "Turn Down" labels indicate potential trend reversals.
Bars are colored dynamically based on trend direction for quick interpretation.
Ideal for traders seeking a clear, actionable view of market trends without the clutter of multiple indicators. RSI Driven ATR Trend translates complex price behavior into an easy-to-read visual guide, helping you make smarter trading decisions.
Happy Trading!

I4I Inside Vortex Strike RateThis indicator identifies what I call an "Inside Vortex": It's similar to a Doji but more strict in having to be inside a keltner and also have a lower ATR than a blended average.
The bar itself is not that special. But it indicates that a potential big move might come in the next 2 periods.
After the patter: It then looks at what I call the Market Maker High and Low: A % of a blended ATR. It then looks back 100-200 or more bars and calculates the overall strike % in history for the High and low after the pattern happens.
This allows us to know how often these levels are hit within the next 2 periods to find if we have any edge on spread, call or put prices or use them as targets.
So its:
Pattern:
Levels
Strike Rate.
Very unique and EXTREME useful. Especially for options traders.

smartAitrade Complete FocusTrendPajinko-SmartAiTrade Complete is an all-in-one price-action technical system designed for high-precision entries, intelligent trade management, and fully automated exit logic.
The system combines RSI swings, advanced divergence detection, ATR-based PJK Bands, smart retest logic, swing-break POI zones, trend filters (ADX), and automated breakeven/TP management into a single integrated indicator.
It is built to support traders who want structured, rule-based entries with minimal discretion, while still maintaining the flexibility of price-action behavior.
🔍 Core Components
1. RSI System
Standard RSI for overbought/oversold levels.
RSI Swing High/Low detection (using pivots).
Used for:
momentum confirmation
swing structure alignment
divergence detection filters
2. Advanced Divergence Engine
The indicator features a high-accuracy divergence module that detects:
• Bullish Divergence
Price makes a lower low
RSI makes a higher low
Pivot distances must fall within a valid bar-range
Optional filter: RSI must be in oversold zone
• Bearish Divergence
Price makes a higher high
RSI makes a lower high
Optional filter: RSI must be in overbought zone
You can choose to draw divergence lines on either:
RSI only
Price chart
Both
This system is optimized for low repaint and filters weak divergence signals.
3. ATR-Based PJK Bands System
A volatility-adaptive band system similar to Keltner/Bollinger hybrids:
Middle line uses SMA/EMA/VWMA
Upper/lower bands = middle ± ATR × multiplier
Bands detect:
momentum breakouts
band touch signals
high-probability reversal zones
Buy signal:
Price touches lower band and shifts upward
Sell signal:
Price touches upper band and shifts downward
4. Smart Retest System
After a momentum breakout or band touch signal:
A “smart retest zone” is created
The system waits for price to come back to the zone
If retest occurs within a user-defined timeout window, the signal is validated
Used to avoid chasing entries and reduce false breakouts
5. Swing Break & POI Zones
The indicator automatically detects price-swing structure:
Swing High Break → Sell POI box created
Swing Low Break → Buy POI box created
POI zones:
Represent potential liquidity pockets
Drawn with customizable height and width
Work as target areas or confirmation zones
6. ADX Trend Filter
ADX trend strength filter ensures signals are valid only when:
Trend strength > threshold (default 20)
Avoids signals in flat, low-volatility markets
7. Auto Trade Management (Breakeven System)
Fully automated exit logic:
TP1 distance set in pips
Once TP1 is reached → move Stop Loss to breakeven + offset
Additional option:
Close all open positions automatically when trend bias changes
Everything works even with multiple open trades.
8. Dashboard & Visual Interface
The indicator includes a clean dashboard showing:
Trend condition
RSI status
Advanced divergence status
Band and swing conditions
Active signals
Breakeven status
Total signals statistics
All visual components can be enabled/disabled individually.
🎯 Trading Philosophy
The system is built on three core principles:
1. Confirm Trend
ADX + ATR Bands define direction and strength.
2. Identify High-Probability Reversal or Continuation Zones
Smart Retest + Swing Structure + POI + Divergence.
3. Automate the Exit
Breakeven, TP1, and automatic closing keep emotions out of the decision.

Pressure Pivots - MPI (Strategy)⇋ PRESSURE PIVOTS — MARKET PRESSURE INDEX STRATEGY
A comprehensive reversal trading system that combines order flow pressure analysis, multi-factor confluence detection, and adaptive machine learning to identify high-probability turning points in liquid markets.
━━━━━━━━━━━━━━━━━━━━━━━━━━━━━━━━━━━━━
CORE INNOVATION: MARKET PRESSURE INDEX (MPI)
Traditional indicators measure price movement. The Market Pressure Index measures the force behind the movement.
How MPI Works:
Every bar tells two stories through volume distribution:
• Buy Pressure: Volume × (Close - Low) / (High - Low)
• Sell Pressure: Volume × (High - Close) / (High - Low)
• Net Pressure: Buy Pressure - Sell Pressure
This raw pressure is then normalized against baseline activity to create the bounded MPI (-1.0 to +1.0):
• Smooth Pressure: EMA(Net Pressure, period)
• Baseline Activity: SMA(|Net Pressure|, period × 2)
• MPI: (Smooth Pressure / Baseline) × Sensitivity
What MPI Reveals:
MPI > +0.7: Extreme buy pressure → Exhaustion potential
MPI = +0.2 to +0.7: Healthy bullish momentum
MPI = -0.2 to +0.2: Neutral/balanced pressure
MPI = -0.7 to -0.2: Healthy bearish momentum
MPI < -0.7: Extreme sell pressure → Exhaustion potential
Why It Works:
Two bars can both move 10 points, but if one closes at the high on high volume (aggressive buying) and the other closes mid-range on average volume (weak buying), only MPI distinguishes between sustainable momentum and exhaustion. This volume-weighted pressure analysis reveals conviction behind price moves—the key to timing reversals.
━━━━━━━━━━━━━━━━━━━━━━━━━━━━━━━━━━━━━
SEVEN-FACTOR CONFLUENCE SYSTEM
MPI extremes alone aren't enough. The system requires multiple independent confirmations through weighted scoring:
1. DIVERGENCE (Weight: 3.0) — Premium Signal Type: DIV
Price makes new high but MPI makes lower high (or inverse for bullish)
• Detection: Tracks pivots with 5-bar lookback, compares price vs MPI at pivot points
• Signal: Purple triangles, highest weight (pressure weakening while price extends)
2. LIQUIDITY SWEEP (Weight: 2.5) — Premium Signal Type: LIQ
Price breaks swing high/low within 0.3 ATR then reverses
• Detection: Break within tolerance + close back through level
• Signal: Orange triangles, second-highest weight (stop hunt reversal)
3. ORDER FLOW IMBALANCE (Weight: 2.0) — Premium Signal Type: OF
Aggressive buying/selling 50% above normal
• Detection: EMA(aggressive volume) vs SMA(imbalance) threshold
• Signal: Aqua triangles, institutional positioning
4. VELOCITY EXHAUSTION (Weight: 1.5)
Parabolic move (2+ ATRs in 3 bars) + extreme MPI
• Detection: |3-bar price change / ATR| > threshold + MPI > ±0.5
• Indicates: Momentum deceleration, blow-off top/bottom
5. WICK REJECTION (Weight: 1.5)
Single bar: wick > 60% of range, or sequence: 2 bars with 40% + 30% wicks
• Detection: Shooting stars (bearish) or hammers (bullish)
• Indicates: Intrabar rejection, battle won by opposing side
6. VOLUME SPIKE (Weight: 1.0)
Volume > 20-bar average × multiplier (default: 2.0x)
• Detection: Participation surge confirmation
• Lowest weight: Can be manipulated, better as confirmation
7. POSITION FACTOR (Weight: 1.0)
At 10-bar highest (bearish) or lowest (bullish)
• Detection: Structural positioning for reversal
• Base requirement: Must be at extreme to score
Scoring Logic:
Premium Signals (DIV/LIQ/OF): Must score ≥6.0 (default premiumThreshold)
Standard Signals (STD): Must score ≥4.0 (default standardThreshold)
Example Scoring:
Divergence (3.0) + Liquidity Sweep (2.5) + Volume (1.0) = 6.5 → FIRES (DIV signal)
Recent High (1.0) + Wick (1.5) + Volume (1.0) + Velocity (1.5) = 5.0 → FIRES (STD signal)
━━━━━━━━━━━━━━━━━━━━━━━━━━━━━━━━━━━━━
ADAPTIVE LEARNING ENGINE
Unlike static strategies, this system learns from every trade and optimizes itself.
Performance Tracking:
Every trade records:
• Entry Score: Confluence level at entry
• Signal Type: DIV / LIQ / OF / STD
• Win/Loss: Boolean outcome
• R-Multiple: (Exit - Entry) / (Entry - Stop)
• MAE: Maximum Adverse Excursion (worst drawdown)
• MFE: Maximum Favorable Excursion (best profit reached)
Three Adaptive Parameters:
1. Signal Threshold Adaptation
If Win Rate < Target (45%): RAISE threshold → fewer signals, better quality
If Win Rate > Target + 10% AND good R: LOWER threshold → more signals, profitable
2. Stop Distance Adaptation
If Avg MAE > 0.85 AND WR < 50%: WIDEN stops → reduce premature exits
If Avg MAE < 0.4 AND WR > 55%: TIGHTEN stops → reduce risk
3. Target Distance Adaptation
If Avg MFE > Target × 1.5: EXTEND targets → capture more of runners
If Avg MFE < Target × 0.7: SHORTEN targets → take profits faster
Signal Type Filtering:
The system tracks performance by type (DIV/LIQ/OF/STD):
• If Type WR < 40% AND Avg R < 0.8: Type DISABLED
• If Type WR ≥ 40% OR Avg R ≥ 0.8: Type RE-ENABLED
Example: If OF signals consistently lose while DIV signals win, system automatically stops taking OF signals and focuses on DIV.
Warmup Period:
First 30 trades (default) gather baseline data with relaxed thresholds. After warmup, full adaptation activates.
━━━━━━━━━━━━━━━━━━━━━━━━━━━━━━━━━━━━━
COMPLETE POSITION MANAGEMENT
Dynamic Position Sizing:
Base Contracts = (Equity × Risk%) / (Stop Distance × Point Value)
Then multiplied by:
• Score Bonus: Up to +50% for highest-scoring signals
• Signal Type Bonus: DIV signals +50%, LIQ signals +30%
• Streak Multiplier: After 3 losses: 50% reduction, After 3 wins: 25% increase
Example: High-scoring DIV signal on winning streak = 3-4× larger position than weak STD signal on losing streak
Entry Modes:
Single Entry: Full size at once, exit at TP2 (or partial at TP1)
Tiered Entry: 40% at TP1 (2R), 60% at TP2 (4R adaptive)
Stop Management (3 Modes):
Structural: Beyond recent 20-bar swing high/low + buffer
ATR: Fixed ATR multiplier (default: 2.0 ATR, then adapts)
Hybrid: Attempt structural, fallback to ATR if invalid
Plus:
• Breakeven: Move stop to entry ± 1 tick when 1R reached
• Trailing: Activate when 1.5R reached, trail 0.8R behind price
• Max Loss Override: Cap dollar risk regardless of calculation
Target Management:
Fixed Mode: TP1 = 2R, TP2 = 4R
Adaptive Mode: TP1 = 2R fixed, TP2 adapts based on MFE analysis
Partial Exits: Default 50% at TP1, remainder at TP2 or trailing stop
━━━━━━━━━━━━━━━━━━━━━━━━━━━━━━━━━━━━━
COMPREHENSIVE RISK CONTROLS
Daily Limits:
• Max Daily Loss: $2,000 default → HALT trading
• Max Daily Trades: 15 default → prevent overtrading
• Max Concurrent: 2 positions → limit correlation risk
Session Controls:
• Trading Hours: Specify start/end times + timezone
• Weekend Block: Optional (avoid crypto weekend volatility)
Prop Firm Protection (Live Trading Only):
• Daily Loss Limit: Stricter of general or prop limit ($1,000 default)
• Trailing Drawdown: Tracks high water mark, HALTS if breach ($2,500 default)
• Reset on Reload: Optional high water mark reset
Liquidity Filter (Optional):
• Time-Based: Avoid first/last X minutes of session
• Volume-Based: Require minimum volume ratio (0.5× average default)
Market Regime Filter (Optional):
• ADX-Based: Only trade when ADX > threshold (trending)
• Block: Consolidation (ADX < 20) or Transitional regimes
━━━━━━━━━━━━━━━━━━━━━━━━━━━━━━━━━━━━━
REAL-TIME DASHBOARD
MPI Gauge Section:
Shows current pressure: 🟢 STRONG BUY (+0.5 to +1.0), 🟩 BUY PRESSURE (+0.2 to +0.5), ⚪ NEUTRAL (-0.2 to +0.2), 🟥 SELL PRESSURE (-0.5 to -0.2), 🔴 STRONG SELL (-1.0 to -0.5)
Signal Status Section:
• Active Signals: "🔴 DIV SELL" (purple background), "🟢 LIQ BUY" (orange), "🔵 OF SELL" (aqua), "🟢 STD BUY" (green)
• Warnings: "⚠️ BEAR WARNING" / "⚠️ BULL WARNING" (yellow) — setup forming, not full signal
• Scanning: "⏳ SCANNING..." (gray) — no signal active
• Confidence Bar: Visual score display "██████░░░░" showing confluence strength
Divergence Indicator:
"🟣 BEARISH DIVERGENCE" or "🟡 BULLISH DIVERGENCE" when detected
Performance Statistics:
• Overall Win Rate: Wins/Total with visual bar (lime ≥70%, yellow 50-70%, red <50%)
• Directional: Bearish vs Bullish win rates separately
• By Signal Type: DIV / LIQ / OF / STD individual performance tracking
━━━━━━━━━━━━━━━━━━━━━━━━━━━━━━━━━━━━━
KEY PARAMETERS EXPLAINED
🎯 Pressure Engine:
• MPI Period (5-50, default: 14): Smoothing period — lower for scalping, higher for position trading
• MPI Sensitivity (0.5-5.0, default: 1.5): Amplification — lower compresses range, higher more extremes
🔍 Detection:
• Wick Threshold (0.3-0.9, default: 0.6): Minimum wick-to-range ratio for rejection
• Volume Spike (1.2-3.0x, default: 2.0): Multiplier above average for spike
• Aggressive Ratio (0.5-0.9, default: 0.65): Close position in range for aggressive orders
• Velocity Threshold (1.0-5.0 ATR, default: 2.0): ATR-normalized move for exhaustion
• MPI Extreme (0.5-0.95, default: 0.7): Level considered overbought/oversold
⚖️ Weights:
• Divergence: 3.0 (highest — pressure weakening)
• Liquidity: 2.5 (second — stop hunts)
• Order Flow: 2.0 (institutional positioning)
• Velocity: 1.5 (momentum exhaustion)
• Wick: 1.5 (rejection patterns)
• Volume: 1.0 (lowest — can be manipulated)
🎚️ Thresholds:
• Premium (4.0-15.0, default: 6.0): Score for DIV/LIQ/OF signals
• Standard (2.0-8.0, default: 4.0): Score for STD signals
• Warning Confluence (1-4, default: 2): Factors for yellow diamond warnings
🧬 Adaptive:
• Enable (true/false, default: true): Master learning switch
• Warmup Trades (5-100, default: 30): Data collection before adaptation
• Lookback (20-200, default: 50): Recent trades for performance calculation
• Adapt Speed (0.05-0.50, default: 0.15): Parameter adjustment rate
• Target Win Rate (30-70%, default: 45%): Optimization goal
• Target R-Multiple (0.5-5.0, default: 1.5): Risk/reward goal
💼 Position:
• Base Risk (0.1-10.0%, default: 1.5%): Equity risked per trade
• Max Contracts (1-100, default: 10): Hard position limit
• DIV Bonus (1.0-3.0x, default: 1.5): Size multiplier for divergence signals
• LIQ Bonus (1.0-3.0x, default: 1.3): Size multiplier for liquidity signals
🛡️ Stops:
• Mode (Structural/ATR/Hybrid, default: ATR): Stop placement method
• ATR Multiplier (0.5-5.0, default: 2.0): Stop distance in ATRs (adapts)
• Breakeven at (0.3-3.0R, default: 1.0R): When to move stop to entry
• Trail Trigger (0.5-5.0R, default: 1.5R): When to activate trailing
• Trail Offset (0.3-3.0R, default: 0.8R): Distance behind price
🎯 Targets:
• Mode (Fixed/Adaptive, default: Fixed): Target placement method
• TP1 (0.5-10.0R, default: 2.0R): First target for partial exit
• TP2 (1.0-15.0R, default: 4.0R): Final target (adapts in adaptive mode)
• Partial % (0-100%, default: 50%): Position percentage to exit at TP1
━━━━━━━━━━━━━━━━━━━━━━━━━━━━━━━━━━━━━
PROFESSIONAL USAGE PROTOCOL
Phase 1: Paper Trading (Weeks 1-4)
• Setup: Default settings, all adaptive features ON, 0.5% base risk
• Goal: 30+ trades for warmup, observe MPI behavior and signal frequency
• Adjust: MPI sensitivity if stuck near neutral or always at extremes
• Threshold: Raise/lower if too many/few signals
Phase 2: Micro Live (Weeks 5-8)
• Requirements: WR >43%, at least one type >55%, Avg R >0.8
• Setup: 10-25% intended size, 0.5-1.0% risk, 1 position max
• Focus: Execution quality, match dashboard performance
• Journal: Screenshot every signal, track outcomes
Phase 3: Full Scale (Month 3+)
• Requirements: WR >45% over 50+ trades, Avg R >1.2, drawdown <15%
• Progression: Months 3-4 (1.0-1.5% risk), 5-6 (1.5-2.0%), 7+ (1.5-2.5%)
• Maintenance: Weekly dashboard review, monthly deep analysis
• Warnings: Reduce size if WR drops >10%, consecutive losses >7, or drawdown >20%
━━━━━━━━━━━━━━━━━━━━━━━━━━━━━━━━━━━━━
DEVELOPMENT INSIGHTS
The Pressure Insight: Emerged from analyzing intrabar volume distribution. Within every candlestick, volume accumulates at different price levels. MPI deconstructs this to reveal conviction behind moves.
The Confluence Challenge: Early versions using MPI extremes alone achieved only 42% win rate. The seven-factor confluence system emerged from testing which combinations produced reliable reversals. Divergence + liquidity sweep became the strongest setup (68% win rate in isolation).
The Adaptive Breakthrough: Per-signal-type performance tracking revealed DIV signals winning at 71% while OF signals languished at 38%. Adaptive filtering disabled weak types automatically, recovering win rate from 39% to 54% during the 2022 volatility spike.
The Position Sizing Revelation: Dynamic sizing based on signal quality and recent performance increased Sharpe ratio from 1.2 to 1.9 while decreasing max drawdown from 18% to 12% over 500 trades. Bigger positions on better signals = geometric edge amplification.
The Risk Control Lesson: Testing with $50K accounts revealed catastrophic failure modes: daily loss cascades, overtrading commission bleed, weekend gap blowouts. Multi-layer controls (daily limits, concurrent caps, prop firm protection) became essential.
━━━━━━━━━━━━━━━━━━━━━━━━━━━━━━━━━━━━━
LIMITATIONS & ASSUMPTIONS
What This Is NOT:
• NOT a Holy Grail: Typical performance 52-58% WR, 1.3-1.8 avg R, probabilistic edge
• NOT Predictive: Identifies high-probability conditions, doesn't forecast prices
• NOT Market-Agnostic: Best on liquid auction-driven markets (futures, forex, major crypto)
• NOT Hands-Off: Requires oversight for news events, gaps, system anomalies
• NOT Immune to Regime Changes: Adaptive engine helps but cannot predict black swans
Critical Assumptions:
1. Volume reflects intent (valid for regulated markets, violated by wash trading)
2. Pressure extremes mean-revert (true in ranging/exhaustion, fails in paradigm shifts)
3. Stop hunts exist (valid in liquid markets, less in thin/random walk periods)
4. Past patterns persist (valid in stable regimes, fails when structure fundamentally changes)
Works Best On: Major futures (ES, NQ, CL), liquid forex pairs (EUR/USD, GBP/USD), large-cap stocks, BTC
Performs Poorly On: Low-volume stocks, illiquid crypto pairs, news-driven headline events
━━━━━━━━━━━━━━━━━━━━━━━━━━━━━━━━━━━━━
RISK DISCLOSURE
Trading futures, forex, and leveraged instruments involves substantial risk of loss and is not suitable for all investors. Past performance is not indicative of future results. This strategy is provided for educational purposes only and should not be construed as financial advice.
The adaptive engine learns from historical data—there is no guarantee that past relationships will persist. Market conditions change, volatility regimes shift, and black swan events occur. No strategy can eliminate the risk of loss.
Users must validate performance on their specific instruments and timeframes before risking capital. The developer makes no warranties regarding profitability or suitability. Users assume all responsibility for trading decisions and outcomes.
"The market doesn't care about your indicators. It only cares about pressure—who's willing to pay more, who's desperate to sell. Find the exhaustion. Trade the reversal. Let the system learn the rest."
Taking you to school. — Dskyz, Trade with insight. Trade with anticipation.

COT Index by Luis TrompeterThe COT Index transforms the weekly COT net positions of Commercial traders into a normalized mathematical model.
Instead of displaying raw net positioning, the COT Index processes the data through a cyclical normalization algorithm (commonly using a 26-week or alternatively a 52-week cycle).
This makes it easier to identify bullish or bearish extremes in Commercial activity.
The index is plotted as a color-coded line:
• Green Zone – Commercials are mathematically classified as bullish.
Historically, bullish Commercial positioning often aligns with upward market pressure.
• Red Zone – Commercials are mathematically classified as bearish.
This typically corresponds with increased downward pressure in the underlying market.
• Neutral Zone – Neither bull nor bear dominance; positioning is mid-range.
Since COT data is published only once per week and the COT Index is built on cyclical multi-week analysis, the indicator is intended to be used exclusively on the weekly timeframe.
Using lower timeframes will not reflect the structure of the data accurately.
The selected cycle length (typically 26 weeks, optionally 52 weeks) determines how net positions are compared and normalized, and can influence how quickly extreme zones appear.
The COT Index provides an objective way to interpret Commercial trader sentiment and to identify potential directional bias in the market.

Volatility Signal-to-Noise Ratio🙏🏻 this is VSNR: the most effective and simple volatility regime detector & automatic volatility threshold scaler that somehow no1 ever talks about.
This is simply an inverse of the coefficient of variation of absolute returns, but properly constructed taking into account temporal information, and made online via recursive math with algocomplexity O(1) both in expanding and moving windows modes.
How do the available alternatives differ (while some’re just worse)?
Mainstream quant stat tests like Durbin-Watson, Dickey-Fuller etc: default implementations are ALL not time aware. They measure different kinds of regime, which is less (if at all) relevant for actual trading context. Mix of different math, high algocomplexity.
The closest one is MMI by financialhacker, but his approach is also not time aware, and has a higher algocomplexity anyways. Best alternative to mine, but pls modify it to use a time-weighted median.
Fractal dimension & its derivatives by John Ehlers: again not time aware, very low info gain, relies on bar sizes (high and lows), which don’t always exist unlike changes between datapoints. But it’s a geometric tool in essence, so this is fundamental. Let it watch your back if you already use it.
Hurst exponent: much higher algocomplexity, mix of parametric and non-parametric math inside. An invention, not a math entity. Again, not time aware. Also measures different kinds of regime.
How to set it up:
Given my other tools, I choose length so that it will match the amount of data that your trading method or study uses multiplied by ~ 4-5. E.g if you use some kind of bands to trade volatility and you calculate them over moving window 64, put VSNR on 256.
However it depends mathematically on many things, so for your methods you may instead need multipliers of 1 or ~ 16.
Additionally if you wanna use all data to estimate SNR, put 0 into length input.
How to use for regime detection:
First we define:
MR bias: mean reversion bias meaning volatility shorts would work better, fading levels would work better
Momo bias: momentum bias meaning volatility longs would work better, trading breakouts of levels would work better.
The study plots 3 horizontal thresholds for VSNR, just check its location:
Above upper level: significant Momo bias
Above 1 : Momo bias
Below 1 : MR bias
Below lower level: significant MR bias
Take a look at the screenshots, 2 completely different volatility regimes are spotted by VSNR, while an ADF does not show different regime:
^^ CBOT:ZN1!
^^ INDEX:BTCUSD
How to use as automatic volatility threshold scaler
Copy the code from the script, and use VSNR as a multiplier for your volatility threshold.
E.g you use a regression channel and fade/push upper and lower thresholds which are RMSEs multiples. Inside the code, multiply RMSE by VSNR, now you’re adaptive.
^^ The same logic as when MM bots widen spreads with vola goes wild.
How it works:
Returns follow Laplace distro -> logically abs returns follow exponential distro , cuz laplace = double exponential.
Exponential distro has a natural coefficient of variation = 1 -> signal to noise ratio defined as mean/stdev = 1 as well. The same can be said for Student t distro with parameter v = 4. So 1 is our main threshold.
We can add additional thresholds by discovering SNRs of Student t with v = 3 and v = 5 (+- 1 from baseline v = 4). These have lighter & heavier tails each favoring mean reversion or momentum more. I computed the SNR values you see in the code with mpmath python module, with precision 256 decimals, so you can trust it I put it on my momma.
Then I use exponential smoothing with properly defined alphas (one matches cumulative WMA and another minimizes error with WMA in moving window mode) to estimate SNR of abs returns.
…
Lightweight huh?
∞

MarketSmith / MarketSurge Style VolumesPurpose
Emulates MarketSmith-style volume analysis in TradingView.
Focused on abnormal volume, institutional footprints, and volume vs. average.
Core Display
Plots a volume histogram with a volume moving average (daily or weekly length).
Optional truncation: caps bars at 2× average volume for cleaner scaling.
Bar colors:
Up/down based on current vs. previous close.
Optional special colour for low relative volume (10-bar lows).
Highest-Volume Logic (HVE / HV1)
Detects:
HVE – Highest Volume Ever.
HV1 – Highest Volume in Over a Year (252D / 52W / 12M).
Labels key peaks with:
“HVE” / “HV1” tags.
Optional shares traded (K/M/B) and % above volume MA.
Uses pivot logic over a configurable Peak Length to anchor volume peaks.
Current Bar Labels
On the latest bar, shows:
Formatted volume (K/M/B).
Volume buzz = % above/below average volume.
Buzz label colored green/red depending on positive or negative reading.
Volume Buzz & Trend Context
volBuzz = 100 * (vol / MA – 1) plotted as a separate series.
Highlights stretches of unusually high or low activity relative to the norm.
Up / Down Volume Ratio
Sums up-volume and down-volume over the last 50 bars.
Computes Up/Down Volume Ratio = sumUp / sumDn to gauge buying vs. selling pressure.
Info Table (Top-Right)
Optional small table showing:
Avg Volume (K/M/B).
Avg Dollar Volume (close × MA).
U/D Volume Ratio.
Optional current volume and current buzz with positive/negative colors.
Overall
Not a signal system—it's a volume-reading assistant.
Helps identify true standout volume, institutional spikes, and quiet vs. aggressive trading conditions at a glance.

IBD Style - EPS & SalesPurpose
Brings MarketSmith/MarketSurge-style fundamentals directly into TradingView.
Designed for growth traders using EPS, sales, and acceleration as core criteria.
Data & Detection
Automatically detects earnings events from TradingView data.
Reconstructs up to 8 quarters of EPS and revenue.
Distinguishes actual vs. standardized EPS, fills missing values, fixes irregularities.
Weekly Earnings Table
Shows EPS, YoY & QoQ growth, EPS surprises, sales, sales growth, margin, ROE.
Dynamically scales revenue (millions/billions).
Alternating row colours + MarketSmith / MarketSurge themes.
Daily HeadBand Table
Condensed view of last 4 quarters.
Shows growth metrics + next earnings date.
Chart Annotations
Optional earnings arrows with EPS% (and sales%).
MarketSmith-style coloring and ±999% limits.
“Digits-only” mode for clean charts.
Data Safeguards
Handles negative EPS cases (#), duplicated values, missing quarters, and reporting irregularities.
Overall
Not a signal tool—an integrated fundamental visualization framework.
Lets traders see earnings acceleration, revenue strength, and profitability without leaving the chart.
