RTH Previous Day's Range + SMTs [bilal x shpat]Overview
This advanced indicator is designed specifically for futures and equity traders who focus on Regular Trading Hours (RTH) sessions. It automatically plots the previous RTH session's high and low levels and detects Smart Money Theory (SMT) divergences across multiple correlated or inversely correlated instruments.
Key Features
📊 RTH Range Detection
Automatically identifies and tracks Regular Trading Hours (9:30 AM - 4:14 PM New York time)
Plots horizontal lines at the previous RTH session's high and low
Works seamlessly on all timeframes, including ETH (Extended Trading Hours) charts
Lines dynamically extend and update as new bars form
🔄 Smart Money Theory (SMT) Divergence Detection
Compares up to 3 correlated or inversely correlated assets simultaneously
Detects bullish and bearish SMT divergences automatically
Visual divergence lines connect previous session levels to current intraday highs/lows
Customizable SMT labels showing which instruments are diverging
Option to mark assets as "Correlated" or "Inversely Correlated" for accurate divergence detection
SMT detection occurs only during RTH sessions for cleaner signals
🎨 Fully Customizable Styling
3 Label Styles: Choose between "Full" (RTH Previous Day High), "Short" (RTH PDH), or "Lowercase" (rth previous day high)
Adjustable Label Sizes: Tiny, Small, Normal, or Large
Custom Colors: Separate color controls for lines, labels, bullish SMT, and bearish SMT
Line Extension: Control how many bars ahead lines extend
Line Width: Customize line thickness
📈 SMT Visual Indicators
Arrow Symbols: ▲ = Higher / ▼ = Lower (for correlated assets)
Alternate Symbols: 🔺 = Higher / 🔻 = Lower (for inversely correlated assets)
Color-coded divergence lines (white by default, fully customizable)
Optional SMT labels showing ticker symbols with directional indicators
Optional comparison table displaying current divergence status
⚙️ Comparison Settings
Add up to 2 comparison symbols (e.g., ES1!, YM1!, NQ1!)
Toggle each comparison asset on/off independently
Set correlation type (Correlated or Inversely Correlated) for each asset
Popular comparisons: ES vs NQ, YM vs ES, Equity vs Futures
🧹 Clean Chart Management
Option to delete previous RTH SMTs when new session starts
Automatic cleanup of outdated lines and labels
Transparent label backgrounds for minimal chart clutter
Lines track exact bar where high/low occurred
How It Works
Session Detection: The indicator identifies when RTH begins (9:30 AM ET) and tracks all price action during the session until close (4:14 PM ET)
Level Capture: At the start of each new RTH session, it captures the previous session's high and low and plots them as reference levels
SMT Analysis: During the current RTH session, it continuously compares the current session's high/low with the previous session's high/low across all selected instruments
Divergence Identification: When one instrument makes a higher high while another makes a lower high (or vice versa), an SMT divergence is detected and visualized
Use Cases
Liquidity Analysis: Identify when markets are taking liquidity at different rates
Reversal Signals: SMT divergences often precede significant reversals
Correlation Trading: Monitor when traditionally correlated markets begin to diverge
Key Level Trading: Use previous RTH high/low as support/resistance levels
Multi-Market Analysis: Compare ES, NQ, and YM simultaneously for institutional flow
Best Practices
Most effective on intraday timeframes (1m - 15m charts)
Works on both RTH and ETH chart sessions - meant to be used on a RTH chart
Compare highly correlated instruments (e.g., ES1! vs NQ1!)
Use in combination with volume analysis and market structure
SMT divergences are most powerful near key levels
Settings Overview
Comparison Symbols
Asset 2 & 3: Select tickers to compare (e.g., ES1!, YM1!)
Correlation toggles for each asset
Enable/disable each comparison independently
Styling
Line color, width, and extension length
Label color, size, and style (3 options)
Separate colors for bullish and bearish SMT lines
SMT Controls
Toggle SMT detection on/off
Show/hide SMT text labels
Optional SMT comparison table
Delete previous session SMTs option
Note: This indicator is best used by traders familiar with Smart Money Concepts (SMC) and inter-market analysis. Understanding market correlations is essential for accurate interpretation of SMT divergences.
thank you shpat for the SMT option in the last indicator, i tweaked it for this one
Multitimeframe

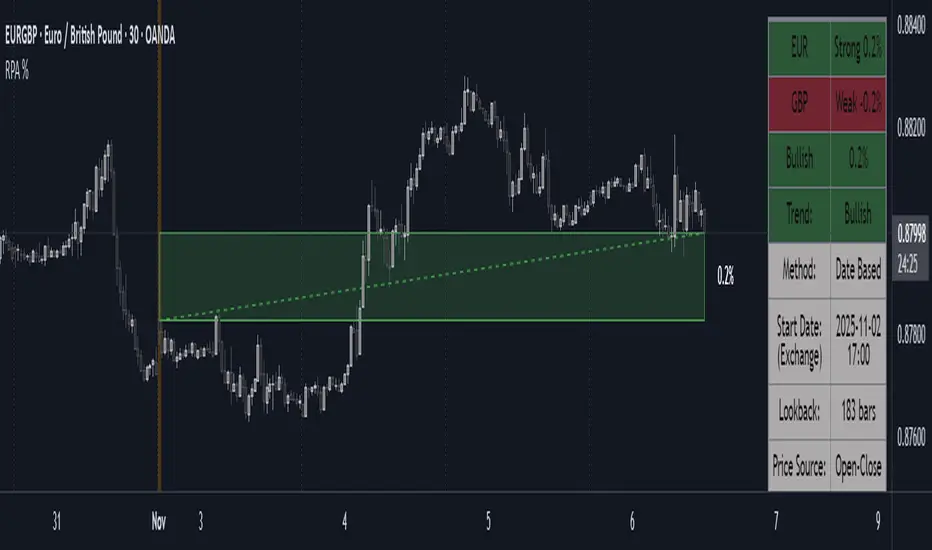
Period Range AnalyzerThis indicator analyzes a specific periodic range, which can start from a fixed date or a defined lookback period. It draws percentage levels and colored zones between the highest and lowest price. It also displays a detailed information table, which shows the price's position within the range in "Trend" mode, and the relative strength of currency pairs in "Forex" mode. The current price position is also indicated by a label with a percentage value and the name of the corresponding zone.
User Guide
Calculation Method
This setting determines how the indicator defines the range used for the calculation.
Lookback Period: In this mode, the indicator uses the last N candles (the number can be specified in the "Lookback Period (bars)" field). The range (the highest and lowest price) is "floating," meaning it is recalculated with each new candle based on the last N candles.
Date Based: In this mode, the calculation starts from a fixed date and time you select. The indicator finds the opening price of the start date and continuously tracks the highest and lowest price from that point on. This mode is ideal for measuring performance from a specific event (e.g., start of a week/month/year, news).
Data Handling Note: If you select a date in "Date Based" mode for which no data is available on the current timeframe (e.g., switching to a very low timeframe), the indicator will automatically use the earliest available candle as the starting point. All calculations (Open, Max, Min, Range, Percentage, Change, Trend) are based on this actual start date.
Start Date & Time
This setting is only active in "Date Based" mode.
Here you can specify the fixed starting point for the calculation.
The specified time is in the Exchange timezone.
Important limitation: Due to TradingView platform limits, visual elements (levels, zones) are only drawn for a maximum of 250 candles back. If the set date is older than this, the calculation still applies to the entire period (from the set date), but the drawing only covers the last 250 candles. The table always displays accurate data for the entire period.
When switching to a higher timeframe, the range may restart from a slightly later bar due to TradingView's bar alignment. For best accuracy, set your timeframe first, then select the start date.
Table Mode
This setting controls what data the information table displays.
Trend: This is the default mode, which works on any symbol (stock, index, crypto, etc.). It displays information related to the trend and the range.
Forex: This is a special mode used to measure the strength of currency and crypto pairs. It only works on symbols with exactly 6 characters (e.g., "EURUSD", "BTCUSD"). It treats the first 3 characters as the base currency (e.g., EUR) and the last 3 as the quote currency (e.g., USD). If the symbol does not have 6 characters, the table will automatically display in "Trend" mode.
Trend
This trend determination operates based on the formation order of the high and low within the analyzed range:
Its switch is located in the “Table Additional Rows” menu.
Bullish: Indicated if the low was formed before the high (on different candles). Or if they formed on the same candle, it was a bullish candle.
Bearish: Indicated if the high was formed before the low (on different candles). Or if they formed on the same candle, it was a bearish candle.
Neutral: Indicated if the high and low formed on the same candle, and it was a "doji" candle (close = open).
Upper & Lower Threshold
These settings (Upper Threshold (%) and Lower Threshold (%) in the "Label Coloring" section) primarily determine the state (Bullish/Bearish/Neutral) of the top row of the table.
The logic is not based on the percentage change of the price movement, but on the current price's position within the range, where the bottom of the range is 0% and the top is 100%.
Upper Threshold (%): The percentage level (e.g., 60.0) above which the indicator considers the price position "Bullish" (or "Strong").
Lower Threshold (%): The percentage level (e.g., 40.0) below which the indicator considers the price position "Bearish" (or "Weak").
If the price is between the two (e.g., between 40% and 60%), the signal is Neutral.
Secondary function: These thresholds also control the color of the label next to the price, provided the "Dynamic Label Coloring" option is enabled.

Quantura - Quantitative AlgorythmIntroduction
“Quantura – Quantitative Algorithm” is an invite-only Pine Script strategy designed for multi-timeframe analysis, combining technical filters with user-adjustable fundamental sentiment. It was primarily developed for cryptocurrency markets but can also be applied across other assets such as Forex, stocks, and indices. The goal is to generate structured trade signals through a confluence of techniques rather than relying on a single indicator.
Originality & Value
Quantura is not a simple mashup of indicators. Its originality comes from how multiple layers of analysis are integrated into a single decision framework . Instead of showing indicators separately, the strategy only issues trades when several conditions align simultaneously:
RSI entry triggers confirm overbought/oversold reversals.
Market structure on a higher timeframe confirms trend direction.
Order block detection highlights zones of concentrated supply and demand.
Premium/Discount zones identify potential over- and undervaluation.
HTF EMA provides trend confirmation.
Optional candlestick patterns strengthen reversal or continuation signals.
An optional correlation filter compares the main asset to a reference instrument.
This design forces agreement between different methodologies (momentum, structure, value, volume, sentiment), which reduces noise compared to using them in isolation.
Functionality & Indicators
Entry trigger: RSI exits from extreme zones.
Filters: Only valid when all selected filters (HTF structure, EMA, order blocks, premium/discount, candlesticks, correlation, volume) confirm the direction.
Fundamental bias: User-defined sentiment and analysis settings (bullish, bearish, neutral) influence whether long or short trades are permitted.
Exits: ATR-based take profit and stop loss, with optional breakeven, opposite-signal exit, and session-end exit.
Visualization: Buy/Sell markers, trend-colored candles, and an optional dashboard summarizing indicator status.
Parameters & Customization
Timeframes: Independent HTF and LTF selection.
Trading direction: Long / Short / Both.
Session and weekday filters.
RSI length and thresholds.
Filters: HTF structure, order blocks, premium/discount, EMA, candlestick, ATR volatility, volume zones, correlation.
Exit rules: ATR multipliers for TP/SL, breakeven logic, session-end exit, opposite-signal exit.
Visuals: Toggle signals, candles, dashboard, custom colors.
Default Properties (Strategy Settings)
Initial Capital: 100,000 USD
Position Size: 15% of equity per trade
Commission: 0.25%
Slippage: enabled
Pyramiding: 0 (one position at a time)
Note: The position sizing of 15% equity per trade is intentionally set for backtesting demonstration. In real trading, risking this much is considered aggressive. Most traders prefer to risk 1-5% of equity, and rarely above 10%.
Backtesting & Performance
Backtests on BTCUSD (2 years) with the above defaults showed:
112 trades
Win rate: 40%
Profit factor: 1.4
Maximum drawdown: 34%
These results illustrate how the confluence model behaves, but they are not predictive of future performance . The trade sample size (72 trades) is below the 100+ usually recommended for statistical robustness. Users should re-test with their own preferred symbols, settings, and timeframes.
Risk Management
ATR-based stops and targets scale with volatility.
Commission and slippage are included by default for realistic modeling.
Opposite-signal exit helps capture trend reversals.
Session-end exit can close intraday positions before illiquid hours.
Breakeven option protects profits when available.
Although the default allocation uses 15% per trade for demonstration, this is not a recommendation. Users are encouraged to adjust risk sizing downwards to sustainable levels (commonly 1-5%).
Limitations & Market Conditions
Performs best in volatile, liquid markets (e.g., crypto).
May struggle in prolonged sideways markets with low volatility.
News events and fundamentals outside user inputs can override signals.
Backtests below 100 trades should be considered exploratory, not statistically conclusive.
Usage Guide
Add “Quantura – Quantitative Algorithm” to your chart in strategy mode.
Select HTF and LTF timeframes, trading direction, and session filters.
Configure confluence filters (structure, EMA, order blocks, premium/discount, candlestick, correlation, volume).
Set sentiment and analysis bias in fundamental settings.
Adjust ATR multipliers and exits.
Review buy/sell signals and analyze performance in the Strategy Tester.
Author & Access
Developed 100% by Quantura . Distributed as an Invite-Only script . Details are provided in the Author’s Instructions field.
Important: This description complies with TradingView’s Script Publishing Rules and House Rules. It does not guarantee profitability, avoids unrealistic claims, and explains how the strategy integrates multiple methods into a coherent decision framework.


HVIB UltimateThis script shows specific VIBs (volume imbalances) Customizable
HVIB - shows all HVIBS for short/ long, timeframe customization (current, 10, 15), colour customization, Fill close customisation (body/wick, number of closes needed to stop showing it as a valid)
2: FVIB indicator - shows two types of Failed vibs
FHVIBs (basicaly HVIBS but only those failed ones)
FVIB - Vib between two same candles closed by the third opposite candle (failed vib)
I like to have those two indicators three times copied for each timeframes /HVIBS 3 times and Fhvibs three times. to turn in quickly on and off and look which timeframes are aligned (which is even stronger I believe)

TPAmacd — Free by TPA OG💎 TPAmacd — Free by TPA OG
Professional Divergence Detection for Confident Technical Analysis
🧭 Overview
TPAmacd is an advanced divergence-analysis tool built for traders who value precision, adaptability, and clarity.
It automatically identifies bullish and bearish divergences on the MACD histogram, confirms momentum shifts, and provides a clean, customizable visual framework — helping you interpret market transitions with greater confidence.
⚙️ Key Features
- Auto-detected Bullish / Bearish Divergences — instantly highlights potential momentum shifts.
- Multi-Timeframe Compatibility — analyze divergences seamlessly across any chart period.
- Histogram Reversal Alerts — get notified as momentum changes direction.
- Customizable Settings — choose between EMA / SMA, set color themes, and adjust visual precision.
- Efficient, Lightweight Design — optimized for clarity and performance on all devices.
📈 Why Traders Choose TPAmacd
- Professional-grade divergence mapping
- Intuitive design — minimal clutter, maximum context
- Adaptable for scalping, swing, or long-term analysis
- Clear alerts and smooth integration with your workflow
⚠️ Important Disclaimer
This script is provided for educational and informational purposes only.
It does not constitute financial, investment, or trading advice.
No indicator, including TPAmacd or any related tools by TPA OG, can guarantee accuracy or profitability.
All trading involves risk, and past performance is not indicative of future results.
Always perform independent analysis and use appropriate risk-management practices before placing any trade.

Range Percentage Analyzer This indicator is a tool for analyzing the market range and trend. It calculates the extent of price movement between a specified starting point and the current price, displaying it as a percentage.
The calculation can be based on a fixed lookback period (e.g., the last 30 candles) or from a fixed start date. It also provides a clear table that shows the general trend in "Trend" mode, and the relative strength of the base and quote currencies of forex pairs (e.g., EURUSD) in "Forex" mode.
User Guide
Calculation Method
This setting determines how the indicator defines the starting point for the calculation.
Lookback Period: In this mode, the indicator uses the last N candles (the number can be specified in the "Lookback Period (bars)" field, maximum 250).
The starting point is "floating," meaning it shifts with each new candle. For example, with a setting of 30, the 30th candle from the current one will always be the starting point.
Date Based: In this mode, the calculation starts from a fixed date and time you select.
This mode is ideal for measuring performance from a specific event (e.g., news, start of a week/month).
Note: If you select a date in "Date Based" mode for which no data is available on the current timeframe (e.g., switching to a very low timeframe), the indicator will automatically use the earliest available candle as the starting point.
Start Date & Time
This setting is only active in "Date Based" mode.
Here you can specify the fixed starting point for the calculation.
The specified time is in the Exchange timezone.
Important limitation: Due to TradingView platform limits, visual elements (box, line) are only drawn for a maximum of 250 candles back.
If the set date is older than this, the calculation still applies to the entire period (from the set date), but the drawing only covers the last 250 candles.
When switching to a higher timeframe, the range may restart from a slightly later bar due to TradingView's bar alignment. For best accuracy, set your timeframe first, then select the start date.
Table Mode
This setting controls what data the information table displays.
Trend: This is the default mode, which works on any symbol (stock, index, crypto, etc.). It displays information related to the trend.
Forex: This is a special mode used to measure the strength of currency pairs.
It only works on symbols with exactly 6 characters (e.g., "EURUSD", "BTCUSD"). It treats the first 3 characters as the base currency (e.g., EUR) and the last 3 as the quote currency (e.g., USD).
If the symbol does not have 6 characters, the table will automatically display in "Trend" mode.
Extremes Trend Row
If this is enabled, the table displays an additional row that determines the trend based on the formation order of the high and low within the analyzed range.
The logic is as follows:
Bullish: Indicated if the low was formed before the high.
(Or if they formed on the same candle, which was a bullish candle).
Bearish: Indicated if the high was formed before the low.
(Or if they formed on the same candle, which was a bearish candle).
Neutral: Indicated if the high and low formed on the same candle, and it was a "doji" candle (close = open).
Upper & Lower Threshold
These settings control the logic for the "Change Trend" and "Forex Display" rows at the top of the table.
They determine when the total percentage change for the entire period is considered "Bullish/Strong", "Bearish/Weak", or "Neutral".
Upper Threshold (%): The percentage value (default 0.1%) above which the indicator considers the change "Bullish/Strong".
Lower Threshold (%): The percentage value (default -0.1%) below which the indicator considers the change "Bearish/Weak".
If the change is between the two, the signal is Neutral.
LinReg Bias MTF + Trading Scenario [Multi-Asset]LinReg Bias MTF + Trading Scenario
Advanced multi-timeframe linear regression indicator with automated trading scenarios for Forex, Commodities, and Indices.
KEY FEATURES:
Multi-timeframe bias analysis (H4, H1, M30/M15)
Linear regression channel with standard deviation bands
Pre-optimized profiles for Forex Majors, Gold, Crude Oil (CL), Copper, US Indices (ES/NQ), and DAX
Automated trading setups with Entry, Stop Loss, and Target levels
Real-time scenario analysis with reliability score (1-5 stars)
Risk/Reward calculator with minimum RR filter
Smart recommended actions based on market conditions
HOW IT WORKS:
The indicator calculates linear regression slopes on 3 timeframes and determines directional bias when slope exceeds threshold AND R² confirms trend quality. When all timeframes align (state = 2), it generates complete trading setups with entry at midline, stop at channel band, and target at opposite band (extended on very strong trends).
SIGNALS:
✅ Green Background = All TF aligned (STRONG BIAS) - High probability trade zone
🟡 Yellow Background = H4+H1 agree, LTF diverges - Setup building, monitor for alignment
🔴 Red Background = H4/H1 conflict - Avoid trading, wait for clarification
RECOMMENDED ACTIONS:
Smart panel displays context-aware advice based on current market condition:
Aggressive entries on strong trends with extended targets
Conservative approach during corrections
No-trade zones during conflicts
Position sizing suggestions based on setup confidence
ALERTS AVAILABLE:
Strong Bias Confirmed - All TF aligned
Trading Setup Ready - Entry, SL, and Target defined
Channel Exit - Price broke regression channel
Conflict Alert - Timeframes in disagreement
R² Below Threshold - Bias invalidated
BEST FOR:
Swing traders and intraday traders seeking high-probability setups with multi-timeframe confirmation. Works across multiple asset classes with optimized parameters for each market.
🇮🇹 VERSIONE ITALIANA
LinReg Bias MTF + Scenario Operativo
Indicatore avanzato di regressione lineare multi-timeframe con scenari operativi automatizzati per Forex, Commodities e Indici.
CARATTERISTICHE PRINCIPALI:
Analisi bias su 3 timeframe (H4, H1, M30/M15)
Canale di regressione lineare con bande di deviazione standard
Profili pre-ottimizzati per Forex Majors, Oro, Petrolio (CL), Rame, Indici USA (ES/NQ) e DAX
Setup operativi automatici con Entry, Stop Loss e Target
Analisi scenario in tempo reale con punteggio affidabilità (1-5 stelle)
Calcolatore Risk/Reward con filtro RR minimo
Azioni consigliate intelligenti basate sulle condizioni di mercato
COME FUNZIONA:
L'indicatore calcola le pendenze di regressione lineare su 3 timeframe e determina il bias direzionale quando la pendenza supera la soglia E l'R² conferma la qualità del trend. Quando tutti i timeframe sono allineati (state = 2), genera setup completi con entry sulla midline, stop sulla banda del canale e target sulla banda opposta (esteso su trend molto forti).
SEGNALI:
✅ Sfondo Verde = Tutti i TF allineati (BIAS FORTE) - Zona operativa ad alta probabilità
🟡 Sfondo Giallo = H4+H1 concordi, LTF diverge - Setup in costruzione, monitorare per allineamento
🔴 Sfondo Rosso = Conflitto H4/H1 - Evitare operazioni, attendere chiarimento
AZIONI CONSIGLIATE:
Il pannello intelligente mostra suggerimenti contestuali basati sulla condizione di mercato:
Entry aggressive su trend forti con target estesi
Approccio conservativo durante correzioni
Zone no-trade durante conflitti
Suggerimenti sul sizing in base alla confidenza del setup
ALERT DISPONIBILI:
Bias Forte Confermato - Tutti i TF allineati
Setup Operativo Pronto - Entry, SL e Target definiti
Uscita dal Canale - Prezzo uscito dal canale di regressione
Allerta Conflitto - Timeframe in disaccordo
R² Sotto Soglia - Bias invalidato
IDEALE PER:
Swing trader e intraday trader che cercano setup ad alta probabilità con conferma multi-timeframe. Funziona su diverse classi di asset con parametri ottimizzati per ogni mercato.

Full Floating Dashboard YUJiDisplay information on top right corner.
Info shown:
High and Low
Current Price
24 Hour Change

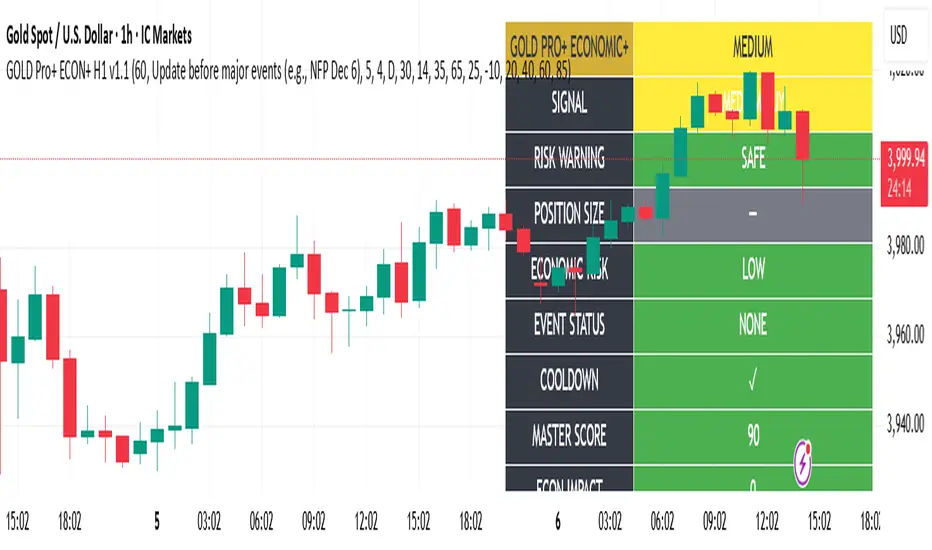
Gold Master Pro Plus ECONOMIC ENHANCED (H1 London v1.1)Overview
This indicator provides gold trading signals with integrated economic calendar awareness, specifically optimized for H1 timeframe and London session trading.
Methodology
The script analyzes multiple technical factors while monitoring economic event risks:
Technical Analysis Components:
RSI for momentum detection with configurable overbought/oversold levels
EMA crossovers (9, 21, 50 periods) for trend direction
MACD for momentum confirmation
ADX for trend strength measurement
Volume analysis for confirmation of price movements
Support/resistance detection using pivot points
Economic Calendar Integration:
Time-based detection of major economic releases (NFP, CPI, FOMC meetings)
Volatility assessment during event periods
USD stability monitoring through currency pair correlations
Automatic cooldown periods after high-impact events
Risk Management Features:
Multi-timeframe confirmation using daily trends
Session-aware scoring (London/NY overlap focus)
Quality-tiered signal classification
Position size recommendations based on signal strength and risk conditions
How to Use
Initial Setup:
Apply to XAUUSD on H1 timeframe
Configure economic settings in the inputs:
Enable economic event filter
Set ET offset (typically 5 hours for winter, 4 for summer)
Select relevant economic events to monitor
Signal Interpretation:
PLATINUM: All conditions aligned (active session, strong volume, low economic risk, trend confirmation)
HIGH: Most factors aligned with moderate risk
MEDIUM: Some factors aligned with acceptable risk
BLOCKED: High economic risk, cooldown period, or manual block active
Dashboard Metrics:
Economic risk level indicates current market safety
Event status shows timing of economic releases
Position size recommends appropriate trade sizing
Master score combines all technical and economic factors
Configuration Options
Economic Settings:
Economic impact threshold (30-80)
ET offset adjustment for timezone accuracy
Cooldown period configuration (2-24 bars)
Technical Settings:
RSI parameters (length, overbought/oversold levels)
Signal thresholds for different quality tiers
Session timing bonuses/penalties
Risk Management:
Multi-timeframe confirmation enable/disable
Higher timeframe selection (D, W, 4H, 12H)
MTF weight percentage (10-50%)
Important Notes
Economic event timing is approximate and should be verified with official economic calendars
Past performance does not guarantee future results
Trading involves substantial risk of loss
This tool is for educational purposes and should not be considered financial advice
The indicator is designed to assist in identifying potential trading opportunities while managing economic event risks through automated protection mechanisms.
MCL RSI Conflux v2.5 — Multi-Timeframe Momentum & Z-Score Full Description
Overview
The MCL RSI Conflux v2.5 is a multi-timeframe momentum model that integrates daily, weekly, and monthly RSI values into a unified composite. It extends the classical RSI framework with adaptive overbought/oversold thresholds and statistical normalization (Z-score confluence).
This combination allows traders to visualize cross-timeframe alignment, identify synchronized momentum shifts, and detect exhaustion zones with higher statistical confidence.
Methodology
The script extracts RSI data from three major time horizons:
Daily RSI (short-term momentum)
Weekly RSI (intermediate trend)
Monthly RSI (macro bias)
Each RSI is optionally smoothed, weighted, and aggregated into a Composite RSI.
A Z-score transformation then measures how far each RSI deviates from its historical mean, revealing when momentum strength is statistically extreme or aligned across timeframes.
Key Features
Multi-Timeframe RSI Engine – Computes RSI across D/W/M intervals with individual weighting controls.
Adaptive Overbought/Oversold Bands – Automatically adjusts OB/OS thresholds based on rolling volatility (standard deviation of daily RSI).
Composite RSI Score – Weighted consensus RSI that represents total market momentum.
Z-Score Confluence Analysis – Identifies when all three timeframes are statistically synchronized.
Z-Composite Histogram – Displays aggregated Z-score strength around the midline (50).
Divergence Detection – Flags confirmed pivot-based bull and bear divergences on the daily RSI.
Dynamic Gradient Background – Shifts from red to green based on composite momentum regime.
Customizable Control Panel – Displays RSI values, Z-scores, state, and adaptive bands for each timeframe.
Integrated Alerts – For crossovers, risk-on/off thresholds, alignment, and Z-confluence events.
Interpretation
All RSI values above 50: multi-timeframe bullish alignment.
All RSI values below 50: multi-timeframe bearish alignment.
Composite RSI > 60: risk-on environment; momentum expansion.
Composite RSI < 45: risk-off environment; momentum contraction.
Adaptive OB/OS hits: potential exhaustion or mean reversion setup.
Green Z-ribbon: all Z-scores positive and aligned (statistical confirmation).
Red Z-ribbon: all Z-scores negative and aligned (broad market weakness).
Divergences: short-term warning signals against the prevailing momentum bias.
Practical Application
Use the Composite RSI as a global momentum gauge for position bias.
Trade only in the direction of higher-timeframe alignment (avoid countertrend RSI).
Combine Z-ribbon confirmation with Composite RSI crosses to filter noise.
Use divergence labels and adaptive thresholds for risk reduction or exit timing.
Ideal for swing traders and macro momentum models seeking trend synchronization filters.
Recommended Settings
Market Mode k-Band Lookback Use Case
Stocks / ETFs Adaptive 0.85 200 Medium-term rotation filter
Crypto Adaptive 1.00 150 Volatility-responsive swing filter
Commodities Fixed 70/30 100 Mean reversion model
Alerts Included
Daily RSI crossed above/below Weekly RSI
Composite RSI > Risk-On threshold
Composite RSI < Risk-Off threshold
All RSI aligned above/below 50
Z-Score Conformity (All positive or all negative)
Overbought/Oversold triggers
Author’s Note
This indicator was designed for research and systematic confluence analysis within Mongoose Capital Labs.
It is not financial advice and should be used in combination with independent risk assessment, volume confirmation, and higher-timeframe context.

The Machine – Session Map PRO (final)The Machine – Session Map
Overview
The Machine – Session Map is a session-based analytical indicator that divides the trading day into the three main global sessions — Asia, London, and New York — and maps their price behavior using structured logic. It’s designed for traders who study intraday cycles, session liquidity behavior, and inter-session relationships.
Core Logic
The indicator identifies the start and end times of each major trading session based on user-defined session times. For every session, it:
Captures session range by recording the high, low, and close between session start and end.
Stores previous session data and projects key levels (previous session high, low, and midpoint) into the next day as reference support/resistance zones.
Computes pip range and volatility metrics per session to measure strength and expansion.
Determines directional bias by comparing the session’s close relative to its open and prior session range (expansion above or below prior structure defines bias).
Detects accumulation and distribution zones using session overlap logic and range compression/expansion criteria.
Labels session structures with automatic annotations such as “Expansion,” “Retracement,” or “Reversal” when volatility or bias conditions are met.
Visual Elements
Session Boxes: Colored regions that visually segment the chart into the three sessions.
High/Low Lines: Dynamic lines showing real-time session highs and lows as price develops.
Previous Session Levels: Optional projection of previous highs/lows/midpoints as structural zones.
Bias Labels: Text markers summarizing session direction and volatility conditions.
Dashboard Panel: Displays current session time, range in pips, and directional bias summary.
Use Case
This tool is useful for identifying intraday structure shifts, comparing session volatility, and observing how price behaves relative to prior session levels. It can support strategies involving session-based liquidity cycles, accumulation/manipulation/distribution behavior, or time-based confluence.
Disclaimer
This indicator is designed for technical and educational analysis. It does not generate buy/sell signals or provide financial advice.

Troop ToolkitGENERAL OVERVIEW:
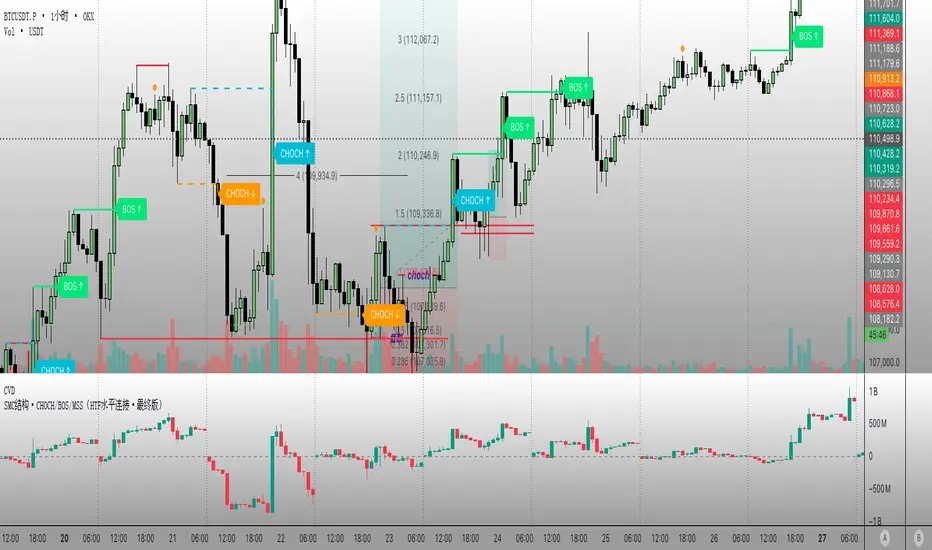
The Troop Toolkit indicator by Flux Charts is an all-in-one toolkit to identify Multi-Timeframe First Fair Value Gaps, Multi-Timeframe Inversion First Fair Value Gap, Fair Value Gaps, Buyside & Sellside Liquidity Levels, SMT Divergences, EQ Ranges, Efficient Candle Ranges, and Volume Imbalances. This indicator was developed by Flux Charts, utilizing concepts taught and traded by Andrew Macre.
ATTRIBUTION NOTICE:
This indicator incorporates concepts and source code from the indicator “Efficient Candle Range (ECR)” authored by @Joeyheick on TradingView. We have received full written permission from the original author to use and commercialize this code within this invite-only script.
Original script: Efficient Candle Range (ECR):
TROOP TOOLKIT FEATURES:
The Troop Toolkit indicator includes 8 main features:
Multi-Timeframe First Fair Value Gaps (FFVG)
Multi-Timeframe Inverse First Fair Value Gaps (IFFVGs)
Fair Value Gaps (FVG)
Buyside & Sellside Liquidity Levels
SMT Divergences
EQ Ranges (EQR)
Efficient Candle Ranges (ECR)
Volume Imbalances (VI)
Multi-Timeframe First Fair Value Gaps (FFVG):
The first feature of this indicator is Multi-Timeframe First Fair Value Gaps (FFVG). These are the first Fair Value Gaps (FVG) that form after a swing high or low is created.
🔹What is a Fair Value Gap?:
To properly understand First Fair Value Gaps (FFVGs), you must understand what a Fair Value Gap (FVG) is. A FVG is an area where the market’s perception of fair value suddenly changes. On your chart, it appears as a three-candle pattern: a large candle in the middle, with smaller candles on each side that don’t fully overlap it. A bullish FVG forms when a bullish candle is between two smaller bullish/bearish candles, where the first and third candles’ wicks don’t overlap each other at all. A bearish FVG forms when a bearish candle is between two smaller bullish/bearish candles, where the first and third candles’ wicks don’t overlap each other at all.
Examples of Bullish & Bearish FVGs:
🔹Why are Fair Value Gaps important?:
Fair Value Gaps show where price moved so quickly that one side of the market never got a chance to trade. They represent sudden shifts in what traders believe something is worth, where “fair value” changed. When a large candle drives straight through an area without overlap from the candles before and after it, it means buyers or sellers were so aggressive that the market skipped that price zone entirely.
These gaps matter because they mark the moment when confidence in price changes. If price rallies and never pulls back, it signals that traders accept the new higher prices as fair and are willing to keep buying there. The same logic applies in reverse for bearish gaps. They tell you where the market re-priced aggressively and where value was last accepted.
🔹What is a First Fair Value Gap?:
A First Fair Value Gap is the very first fair value gap that forms immediately after a new swing high or swing low. It marks the first sign of imbalance following a key turning point in price.
When a major swing low forms, the first bullish FVG that appears afterward shows where buyers first stepped in with enough strength to shift momentum upward. When a swing high forms, the first bearish FVG that appears afterward shows where sellers first regained control.
Because it’s tied directly to a confirmed swing point, an FFVG carries more weight than a regular FVG that forms randomly in the middle of a large move. It identifies where a new phase of price delivery begins, which is the first sign that the market is repricing after completing a prior leg.
🔹How are First Fair Value Gaps Detected?:
The indicator identifies First Fair Value Gaps (FFVGs) by starting with a swing high or swing low, which is detected using the 5-minute timeframe.
A swing high is formed when a candle’s high is higher than the two candles before and after it.
A swing low is formed when a candle’s low is lower than the two candles before and after it.
Each time a new swing high or low is confirmed, the indicator marks that area as a “pivot.” From that moment, the script begins looking for the first valid Fair Value Gap that forms after that swing.
To identify a First Fair Value Gap (FFVG), you should first identify a swing high and swing low. These are the most recent highest and lowest areas price reached. A bullish FFVG is the first bullish FVG that forms after a swing low. A bearish FFVG is the first bearish FVG that forms after a swing high.
This indicator automatically detects bullish and bearish FFVGs across the 1-minute, 2-minute, 3-minute, 4-minute, and 5-minute timeframes simultaneously. You will only be able to view FFVGs from timeframes that are equal to or less than your chart’s timeframe. For example, if you are using a 3-minute chart, you’ll only be able to view 1-minute, 2-minute, and 3-minute FFVGs, but not 4-minute or 5-minute FFVGs.
In the indicator settings, under the “FFVGs” section, you can toggle on/off which timeframes are used for FFVG detections. The following settings correspond to the following timeframes:
1 → 1-minute timeframe
2 → 2-minute timeframe
3 → 3-minute timeframe
4 → 4-minute timeframe
5 → 5-minute timeframe
In this screenshot, the chart timeframe is set to the 5-minute, and all the FFVG timeframes are enabled in the settings. Thus, 1-minute, 2-minute, 3-minute, 4-minute, and 5-minute FFVGs will be displayed on the chart.
The ‘Sweep Proximity’ setting determines how soon after a swing high/low the indicator will show the First Fair Value Gap. After a high/low forms, the indicator looks for the very first gap that forms and shows it, but only if it appears within the number of bars you choose. This distance is measured using your current chart timeframe. For example, on a 1-minute chart, a value of 6 means the FFVG must form within 6 bars (6 minutes) after the high/low is detected. Smaller values show only the most immediate FFVGs after a high/low forms. Larger values allow FFVGs to be detected farther away from the high/low, which may display more zones but can increase chart clutter. The default value is 6.
Users can also customize how FFVG zones appear. The settings let you change the color and transparency of bullish and bearish FFVGs, turn the midline on or off, and enable or disable FFVG labels. When labels are enabled, they show the timeframe the FFVG came from, making it easy to identify whether it was detected on the 1m, 2m, 3m, 4m, or 5m chart.
Multi-Timeframe Inversion First Fair Value Gaps (IFFVG):
The second feature of this indicator is Multi-Timeframe Inversion First Fair Value Gaps (IFFVG). These form when a FFVG is invalidated by a candle close on the 5-minute timeframe.
Bullish IFFVG: A bullish IFFVG forms when a 5-minute candle closes above a bearish FFVG, invalidating it.
Bearish IFFVG: A bearish IFFVG forms when a 5-minute candle closes below a bearish FFVG, invalidating it.
The IFFVGs will be displayed from all the timeframes that are enabled for FFVGs. For example, if only the 1-minute, 2-minute, and 3-minute FFVGs are enabled, then only IFFVGs from the 1-minute, 2-minute, and 3-minute timeframes will be displayed.
Users can also customize how IFFVG zones appear. The settings allow you to change the color and transparency of bullish and bearish IFFVGs, adjust the color of IFFVG borders, the thickness of the borders, turn the midline on or off, and enable or disable IFFVG labels. When labels are enabled, they show the timeframe the IFFVG came from, making it easy to identify whether it was detected on the 1m, 2m, 3m, 4m, or 5m chart.
Fair Value Gaps (FVG):
The indicator automatically detects regular bullish and bearish Fair Value Gaps (FVG). However, the indicator only plots FVGs that are NOT First Fair Value Gaps. This prevents FVGs and FFVGs from overlapping each other. There is no style customization for Fair Value Gaps. Users can only toggle them on or off through the indicator settings.
Liquidity Levels:
The indicator automatically plots Buyside & Sellside liquidity levels using user-specific session highs/lows and swing highs/lows.
Sessions used and their time periods (in EST):
Asia Session (20:00 - 00:00)
London Session (02:00 - 05:00)
NY AM Session (09:30 - 11:00)
NY PM Session (14:00 - 16:00)
All highs/lows that have not been ‘swept’, meaning price never crosses above (for highs) or below (for lows), will remain plotted on the chart. After a level is swept, it will become gray.
Swing Highs/Lows are plotted using the color selected from the ‘Colors’ setting under the ‘Liquidity Levels’ section. These levels are plotted with the following labels “ SSL” for lows and “ BSL” for highs. For example, “5M SSL” would be a 5-minute low.
The Asia Session Highs/Lows are plotted yellow with the following labels “Asia Low” & “Asia High”
The London Session Highs/Lows are plotted green with the following labels “London Low” & “London High”
The NY AM Session Highs/Lows are plotted orange with the following labels “NY AM Low” & “NY AM High”
The NY PM Session Highs/Lows are plotted blue with the following labels “NY PM Low” & “NY PM High”
Users can toggle these levels on/off, toggle session highs/lows on/off, toggle text labels on/off, and customize the colors used for swing highs/lows.
SMT Divergence:
This indicator automatically highlights SMT Divergences that occur between the current selected chart ticker and a second user-selected ticker.
A SMT Divergence forms when the prices of the currently selected chart ticker and the user-selected ticker don’t follow each other. For example, if the current chart’s ticker symbol is SEED_ALEXDRAYM_SHORTINTEREST2:NQ and the user-selected ticker is $ES. If SEED_ALEXDRAYM_SHORTINTEREST2:NQ does not sweep the low of the NY AM Session, but NYSE:ES sweeps that same exact session’s low during the same candle, then a SMT Divergence is detected.
In the images below, SEED_ALEXDRAYM_SHORTINTEREST2:NQ and NYSE:ES form a low at 10:45 AM on August 27th. At 11:30 AM, the 10:45 AM low is taken out on $NQ. However, on NYSE:ES , price failed to take out this exact low at 11:30 AM. Thus, an SMT Divergence is detected, and a bubble is plotted on the SEED_ALEXDRAYM_SHORTINTEREST2:NQ chart.
NYSE:ES Chart:
SEED_ALEXDRAYM_SHORTINTEREST2:NQ Chart:
When hovering over the SMT Divergence bubble, a textbox will appear which includes more information about the current SMT Divergence. These text boxes can include one of the following messages:
$TICKER failed high/low
$TICKER took high/low
$TICKER failed high/low
$TICKER took high/low
“$TICKER failed high/low” and “$TICKER failed high/low”: This textbox message occurs when the chart’s symbol creates a new high/low after a high/low formed, but the user-selected ticker fails to create a new higher high or lower low (similar to the SEED_ALEXDRAYM_SHORTINTEREST2:NQ and NYSE:ES example images above).
“$TICKER took high/low” and “$TICKER took high/low”: This textbox image occurs when the user-selected ticker creates a new higher high / lower low after a high/low formed, but the chart’s ticker fails to create a new higher high or lower low.
The indicator uses the levels described above in the ‘Liquidity Levels’ section to detect SMT Divergences. This includes all the session highs/lows and swing highs/lows.
Users can toggle on/off SMT Divergences through the settings. They can also change the ticker used for detections. Since SMT Divergences occur by comparing two tickers, the inputted ticker within the settings will always be compared to the current selected ticker on your chart.
Users can also adjust the colors used for SMT Divergence bubbles at highs and lows. By default, green bubbles appear when an SMT Divergence occurs from a low, and red bubbles appear when an SMT Divergence occurs from a high.
EQ Range:
The EQ Range shows you where price is finding fair value during the New York session. It does this by comparing two VWAP levels: one influenced by global trading and one driven by New York session volume. When both are available, it plots a live zone between them.
This zone updates every bar and extends to the right, so you can see where price may consolidate, stall, or snap back toward during the New York session. The EQ Range only appears during the New York session.
Within the indicator settings, users can toggle the EQ Range zone on/off.
Efficient Candle Range:
Efficient Candle Ranges (ECR) mark areas where the market is moving smoothly without one side (buyers or sellers) moving price aggressively. An “efficient candle” is simply a candle where the body is small compared to the whole candle and the wicks are fairly similar in size. That means buyers and sellers both participated, and price wasn’t pushed too far in either direction.
When one of these candles forms, the indicator creates a zone using its high and low. If more efficient candles appear in a row, the zone can widen to include any new highs or lows they create. The box continues to extend forward as long as price stays inside it.
If price closes outside the top or bottom of the box, the zone is no longer active and visually fades out. While active, it shows where the market is moving in a controlled way, which typically leads to pauses, retests, or a strong move once price breaks out of the range.
Within the indicator settings, users can customize the active ECR zone color, inactive ECR zone colors, and the text color for ECR labels. ECRs can be toggled on/off as well.
Volume Imbalance:
A Volume Imbalance forms when one candle does not properly overlap the trading range of the previous candle. For example, if a bullish candle opens above the previous candle’s close and price did not trade back down into that gap, there was no two-way trade in that price region. That means sellers never had a chance to transact there. The same applies in reverse for bearish moves. When that happens, there is a “missing volume” zone between the two candles because one side of the auction was skipped.
When the indicator detects that kind of gap, where the open and close relationship between two candles leaves untraded space, it marks that area with a box labeled “VI.” A bullish volume imbalance means buyers pushed through a level without sellers trading back into it. A bearish volume imbalance means sellers drove price lower without buyers filling in behind them.
Once price has fully filled the gap, meaning it traded back between the area that was skipped, the gap is deemed as inactive and removed from the chart.
In the settings, users can toggle on/off Volume Imbalances and also adjust the colors for Bullish VIs and Bearish VIs.
Important Notes:
TradingView has limitations when running features on multiple timeframes, such as FFVGs and IFFVGs, which can result in the following restriction:
Computation Error:
The computation of using MTF features is very intensive on TradingView. This can sometimes cause calculation timeouts. When this occurs, simply force the recalculation by modifying one indicator’s settings or by removing the indicator and adding it to your chart again.
UNIQUENESS:
The Troop Toolkit indicator solves a major workflow problem that has never been automated before on TradingView. The most important piece: automatic detection of First Fair Value Gaps (FFVGs) and their proper conversion into Inversion First Fair Value Gaps (IFFVGs). These two concepts require strict rules, swing validation, multi-timeframe comparison, and invalidation logic that traders can currently only do manually. There is no other indicator on TradingView that handles FFVG + IFFVG logic correctly across multiple intraday timeframes at once. Before this tool was created, traders had to manually scan five different timeframes every day and track every first fair value gap that formed after a significant high/low was formed. This took hours each week and was prone to inconsistencies. Troop Toolkit automates the entire process with clear validation rules, making this the first indicator to fully operationalize FFVG + IFFVG workflow.

Higher Timeframe Box & Divider - All Candles [GoldnHunt]The Higher Timeframe Box & Divider – All Candles indicator visually maps higher timeframe candles onto lower timeframe charts.
It highlights the open and close range of each higher timeframe candle as a box, along with a vertical divider marking the start of each new period.
This helps traders clearly see higher timeframe structure and momentum flow without switching charts.
Features:
Draws a box showing only the body (open to close) of each higher timeframe candle.
Uses candle color to represent bullish and bearish momentum.
Adds a divider line for each new higher timeframe candle.
Works across all symbols and timeframes.
Lightweight and optimized for performance.
Use case:
Perfect for traders using multi-timeframe (MTF) analysis who want to visualize higher timeframe candle progression while observing lower timeframe price action.

Momentum Pro [FluxQuant]Momentum Pro — Adaptive Momentum & Regime Filter
Overview
Momentum Pro is a next-generation oscillator that combines rate-of-change (ROC), relative-strength (RSI), and stochastic-momentum frameworks into a unified adaptive model. It dynamically filters momentum through volatility, directional-movement, and trend-strength conditions to highlight only qualified signals in changing market regimes.
🔹 Key Features
Selectable Core Algorithm: Choose between ROC, RSI, or Stochastic momentum engines
Adaptive Signal System: Cross-based entries gated by volatility and trend filters
Quality Filters: Volatility, momentum intensity, and directional bias validation
Overbought / Oversold Zones: Automatic detection with background visualization
Multi-Timeframe Sync: Confirm intraday signals with higher-timeframe momentum
Divergence Scanner: Pivot-based detection of regular bullish / bearish divergences
Smart Dashboard: Real-time summary of market state, momentum strength, and filter status
Dynamic Visual Themes: Gradient, Premium, and Glassmorphism histogram modes
🧠 How It Works
Momentum Pro calculates normalized momentum using your selected algorithm and applies layered filters to ensure that only statistically significant moves are emphasized.
The volatility filter measures current vs. average ATR to confirm expansion.
The trend filter assesses DI +/ DI – differentials for directional bias.
The momentum gate suppresses signals during consolidation or low-range conditions.
Optional higher-timeframe data aligns local momentum with broader bias for cleaner entries.
When these filters agree, momentum crossovers or divergences are visually highlighted as potential study points — not trade instructions.
📈 Interpreting the Dashboard
Field Meaning
Market State Identifies current regime (Bullish, Bearish, Overbought, Oversold, Ranging)
Momentum Current oscillator value (0–100 normalized scale)
Change Recent acceleration / deceleration in momentum
Filter Whether volatility and trend criteria are satisfied
Signal Active cross or directional alignment
Trend / Vol / Intensity Strength metrics (Elite mode)
HTF Sync Confirms alignment with higher-timeframe momentum bias
Use the dashboard as a contextual overlay — not as a mechanical signal generator.
🧩 Configuration Guide
Algorithm: Select ROC for reactive speed, RSI for balanced smoothness, or Stochastic for cyclical range focus.
Signal Line: Enable to visualize crossovers. “Glow” style enhances contrast for clarity.
Filters: Keep “Enable Filter” active to limit noise. Adjust Volatility & Trend thresholds for sensitivity.
Zones: Use background fills to mark overbought / oversold regions and regime shifts.
Divergence: Turn on for automatic pivot-based divergence marking.
Multi-Timeframe: Enable HTF confirmation to study alignment with larger trend context.
Dashboard: Choose Minimal → Elite modes depending on information density preference.
🧭 Best Practices
Works on all markets — equities, futures, crypto, FX
Ideal for 15 m – 4 h – Daily timeframes
Pairs well with structure or liquidity analysis for confirmation
Use filters to isolate expansion phases; avoid trading during neutral states
⚠️ Disclaimer
Momentum Pro is an educational and analytical tool intended for research and visualization only.
It does not provide financial advice, trade signals, or guaranteed outcomes.
Always conduct independent analysis and risk assessment before making trading decisions.
🛠 Release Notes
v 1.0 — Initial Public Release
Multi-algorithm momentum core (ROC / RSI / Stochastic)
Volatility + trend quality filter system
Multi-timeframe synchronization and ribbon overlay
Divergence scanner and contextual dashboard
Dynamic visualization modes

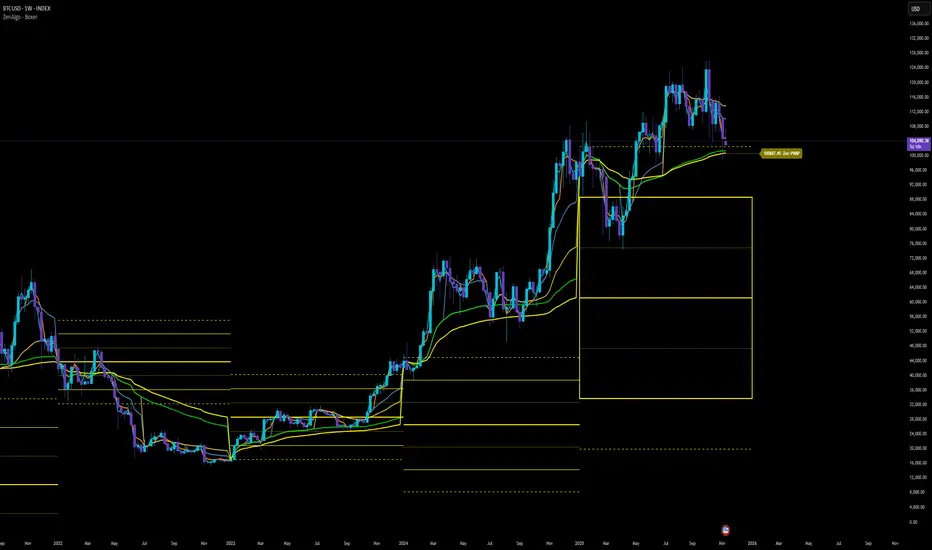
ZenAlgo - BoxerThis indicator plots multi-period Volume-Weighted Average Price (VWAP) ranges and deviation bands across several timeframes — specifically weekly, monthly, quarterly, semi-annual, and yearly. It is designed to visualize how price evolves relative to statistically weighted value areas within each period, based on both traded price and volume distribution.
Each timeframe layer is drawn independently, using its own cumulative VWAP and standard deviation calculation, and displayed as horizontal ranges aligned precisely with calendar periods. This structure allows the chart to show where price currently trades relative to past value zones and how each higher-timeframe VWAP acts as a dynamic reference for mean reversion or continuation.
Calculation Logic
1. Source and Base Inputs
The indicator uses the average of high, low, and close as its price source.
Stocks reset daily at session open.
2. VWAP and Deviation Computation
For each active timeframe, it accumulates the product of price and volume and divides it by cumulative volume, forming a continuously updated VWAP within that period.
The dispersion of price around VWAP is measured through a volume-weighted variance, converted to standard deviation.
These values form symmetrical bands around the VWAP (±1σ, ±2σ, etc.), describing the statistically typical price spread.
3. Range Drawing and Persistence
When a new period begins (e.g., a new week or month), the script finalizes the previous VWAP and deviation values, fixes them to time coordinates representing the full duration of that completed period, and draws corresponding lines or boxes across the entire range.
The user can control how many historical periods remain visible, ensuring performance and clarity even on high-frequency charts.
Each band can be toggled independently (for example ±1, ±2, ±3 deviations), and colors are adjustable per timeframe.
4. Adaptive Time Anchors
The start of each timeframe is aligned with calendar boundaries.
For stocks, the start time aligns with 9:30 New York time to coincide with market open for NYSE.
Each new anchor triggers a reset of cumulative data and creation of a new VWAP range.
5. Visualization Structure
The weekly layer is drawn first and can optionally display live VWAP bands extending backward for a user-defined number of weeks.
Monthly, quarterly, semi-annual, and yearly layers use the same computation principle but with independent accumulation windows.
The central VWAP line is dashed, while outer deviation levels are drawn as dotted or solid lines depending on their multiplier.
Boxes are rendered for key deviation intervals (e.g., ±2σ) to highlight broader value zones.
Interpretation
The VWAP represents the mean price weighted by traded volume for the given period.
Deviation bands describe statistically typical distance from that mean; outer bands mark less frequent extremes.
When price remains within ±1σ or ±2σ, it suggests balance around fair value.
Repeated touches or breaks beyond outer deviations indicate expansion or compression of volatility relative to prior periods.
Overlaps of VWAPs from multiple timeframes reveal multi-period confluence zones, useful for observing where long-term and short-term value agree or diverge.
Recommended Timeframes by Range Type
Weekly Range
Recommended timeframe: 30m to 12h
Suggested options: 30m, 1h, 2h, 3h, 4h, 6h, 8h, 12h
Using lower timeframes (like 5m) is technically possible, but higher ones provide smoother visualization and better readability.
Monthly Range
Recommended timeframe: 1h to 1D
Suggested options: 1h, 2h, 3h, 4h, 6h, 8h, 12h, 1D
Lower timeframes such as 30m may not display the full monthly range due to TradingView’s bar limits, so use higher TFs for complete coverage.
Quarterly Range
Recommended timeframe: 4h to 1W
Suggested options: 4h, 6h, 8h, 12h, 1D, 1W
Quarterly ranges benefit from higher timeframes to ensure that enough historical data is visible without exceeding chart limits.
Semi-Annual Range
Recommended timeframe: 12h to 1M
Suggested options: 12h, 1D, 1W, 1M
Lower timeframes would require too many bars to load a full six-month range; higher TFs offer a clearer overview.
Yearly Range
Recommended timeframe: 1D to 1M or higher
Suggested options: 1D, 1W, 1M
Yearly ranges often cannot display correctly on low timeframes (e.g. 1h) because of TradingView’s maximum bar limits — for instance, five years of 1h data exceeds 40,000 bars. Use higher TFs for accurate rendering.
Added Value Compared to Common Free VWAP Indicators
Incorporates five independent timeframes simultaneously (week, month, quarter, half-year, year) with exact calendar anchoring and timezone handling.
Calculates volume-weighted deviation for each layer, maintaining consistent statistical scale across assets.
Provides historical box persistence , allowing comparison of completed VWAP structures instead of only current running lines.
Enables selective visibility, bandwidth control, and precise visual differentiation through adjustable colors and line weights.
Limitations and Notes
The indicator does not generate trading signals. It is purely analytical and descriptive.
On very low timeframes or illiquid assets, deviation values may fluctuate if volume data is inconsistent.
Historical boxes are approximate in length for months with fewer than 31 days; this simplification has negligible effect on interpretation.
High visual density may occur when enabling many deviations or timeframes at once; users should limit visible history for performance.
Best Usage Practices
Apply on intraday charts (5–240 min) to study how price interacts with weekly or higher-timeframe VWAP zones.
Observe convergence of VWAPs from multiple periods to locate significant equilibrium levels.
Use outer deviations to frame potential exhaustion or re-entry zones rather than directional predictions.
Combine with independent volume- or structure-based analysis for context.
PipGuard RollerPipPipGuard RollerPip – Confirmed Swing (H/L) Detector with Visual Guidance
Indicator published by PipGuard.
PipGuard RollerPip is a confirmed swing detector that plots H (swing high) and L (swing low) labels directly on the chart. It includes horizontal guides extending to the current candle and a compact legend showing the latest detected swing.
The logic is designed to identify true structural swings , filtering out market noise and ignoring minor fluctuations that lack technical relevance.
How it Works
• Detection Method (Non-Classical):
Unlike traditional 3-candle or fractal models (e.g., ICT-style structures), RollerPip employs a more refined process. It combines trend dynamics , movement amplitude , volume intensity , and closing behavior within a dynamic bar range .
This approach allows it to detect genuine structural swings moments where price exhaustion or continuation is confirmed while drastically reducing false signals.
• Labels and Guides:
Each confirmed swing generates an H (High) or L (Low) label with a progressive effect that softens over time.
Optional horizontal guides extend the swing level to the current candle, offering a clear visual anchor for ongoing analysis.
• Dynamic Legend:
A mini-legend updates in real-time, showing the most recent swing (H or L) for immediate context of the current market phase.
• Built-in Alerts (Focus):
Alerts trigger only on candle close when a new confirmed swing High or Low is detected.
Notifications automatically include symbol and timeframe , ensuring you never miss a key structural move , even when away from the chart.
How to Use
1. Add the script to your chart.
2. Observe the H/L labels to identify confirmed swing points.
3. Use the guides to maintain a visual reference up to the current bar.
4. Enable alerts (New Swing HIGH / LOW) to receive automatic notifications whenever a new swing is confirmed.
5. Integrate this information into your own technical workflow and risk management system.
EXAMPLE OF USE
EXAMPLE OF USE
Settings
• `Label Size` → Controls the size of H/L markers.
• `Swing → Current Candle Guides` → Enables or disables guide lines.
• `Maximum Guide Length (bars)` → Sets the extension of the visual reference.
• `Dashed Style` → Toggles between solid or dashed line style.
• Integrated Alerts: Two ready-to-use conditions ( New Swing HIGH / LOW ) with formatted messages (ticker + timeframe).
• All visual parameters are preconfigured to ensure a clean, consistent, and professional display.
Limitations
• Swings are confirmed on bar close they validate turning points but do not anticipate them.
• In low-volatility or sideways phases, more frequent swings may appear.
• Past performance does not guarantee future results .
Access
This script is available under invite-only access .
To request access, use the link provided in our Signature below this publication.
Note: This is a technical analysis tool designed to study price structure and movement. It does not constitute investment advice or imply guaranteed outcomes.
Indicator published by PipGuard.

EMA921// ─────────────────────────────────────────────
// Notes for Publishing
// ─────────────────────────────────────────────
// This script plots EMA 9 and EMA 21 with trend shading.
// Colors: EMA 9 = Orange, EMA 21 = White
// Ideal for short-term trend following & entries.

Multi-Period MTF RSI MomentumThis indicator gives multi-period and multi-timeframe RSI momentum.
There are three RSI indicators. Current, Lower and Higher timeframes.
The relative position of different time frame RSIs provide relative momentum indication. Lower timeframe RIS above Higher time frame indicate improving momentum.
If the RSI is above 55 then stay bullish, below 45 bearish and 45-55 is ranging.
There are many strategies you can trade. one is if the high of candle where RSI cross 55 is crossed then buy, or low of the RSI crossng below 45 is broken ten sell etc.

Multi-Timeframe RSI TableIt can print RSI values of any four chosen periods in a tabular format on the chart itself. The table can be placed in any of the six positions, as required. If the RSI values are more than 40 or less than 40, these values are shown in bright Red, else it is light Red.


MTF Support & Resistance (Optimized)🧠 Smart Multi-Timeframe Support & Resistance (4H / 1H)
This advanced indicator automatically detects, clusters, and visualizes high-probability support and resistance levels across multiple timeframes — giving traders a clean and intelligent market map that adapts to price action in real time.
🔍 How It Works
The script scans historical 4-hour and 1-hour charts to identify swing highs and lows using pivot logic.
It then applies ATR-based clustering to merge nearby levels, filters weak or irrelevant zones, and highlights the most significant price reaction areas based on the number of touches and proximity to the current price.
Each level’s thickness and transparency are dynamically adjusted by strength:
Thicker lines = more confirmations (stronger level)
Fainter lines = weaker, less-tested level
⚙️ Main Features
✅ Multi-Timeframe Analysis (4H + 1H)
✅ Automatic pivot detection and level clustering
✅ Smart filtering based on ATR, proximity, and touch count
✅ Dynamic line width and opacity that scale with level strength
✅ Minimal clutter — only the most relevant nearby levels are displayed
✅ Color-coded visualization for quick interpretation
🔴 Red = 4H Resistance
🟢 Lime = 4H Support
🟠 Orange = 1H Resistance
🟦 Aqua = 1H Support
🎯 Ideal For
Scalpers, swing traders, and intraday analysts who want:
A clear visual map of major reaction zones
Automatic detection of high-confluence levels
A smart, adaptive system that works across assets and timeframes
📈 Usage Tips
Combine with volume, order-flow, or market-structure tools for confluence.
Use higher-strength levels (thicker lines) as bias zones for entries and exits.
Enable or disable 4H/1H visibility to match your trading style.
Built with precision and performance in mind — this Smart S&R system transforms raw swing data into a readable, multi-layered price map for confident trading decisions.
