TheStrat: Timeframe Continuity Failed 2This indicator highlights TheStrat Failed 2 reversals only when the market is in Full Time Frame Continuity (FTFC) based on your chosen timeframes.
It is designed for high-probability directional trades with strong trend confirmation.
⸻
What It Detects
Failed 2 (Reversal Setup)
A Failed 2 occurs when price breaks one side of the previous candle, then fails and closes in the opposite direction:
• Failed 2D → Bullish reversal
• Failed 2U → Bearish reversal
This produces trapped breakout traders, often leading to explosive continuation.
FTFC measures whether price is above or below the opening price of higher timeframes.
If selected timeframes are all aligned, trend conviction is strong.
You can toggle ON/OFF each timeframe to define FTFC:
• 1H
• 1D
• 1W
• 1M
• 1Q
• 1Y
Only the timeframes you select must agree.
⸻
Modes for Different Styles
This indicator supports different trading horizons.
Swing Mode (Recommended for Options 1–5 Days Out)
Focus: Fast multi-day trend continuation
Ideal holding: 1–5 days
Best for: Weekly option expirations
Enable:
• 1H → Entry trigger timeframe
• 1D → Short-term direction
• 1W → Swing trend
• 1M → Macro push behind the move
• Q / Y not required
You end up catching the 1H reversal ignition, with Daily/Weekly/Monthly backing it.
Great for:
• Tuesday–Thursday continuation plays
• Multi-day directional runs
• “Ride the weekly magnitude”
Macro Mode (Long-Term Trend Filter)
Focus: Broad market bias
Ideal holding: weeks to months
Best for: Equity swing traders, leaps, ETF positioning
Enable:
• 1W
• 1M
• 1Q
• 1Y
• 1H / 1D not required
Used to ensure you’re riding institutional trend, not counter-trend noise.
Can be paired with a lower-TF entry tool like this indicator running in Swing Mode.
Label Up “F2D FTFC↑!” —— Bullish Failed-2 triggers FTFC → long setup
Label Down “F2U FTFC↓!” —— Bearish Failed-2 triggers FTFC → short setup
Small Circles —— Failed-2 continuation while FTFC remains intact
Optional Intrabar Alerts when price begins to form a Failed-2.
All plotted entries are close-confirmed unless you enable intrabar alerts.
Multitimeframe

Daily Open Range - TatoshiDisplays a daily open range for both current and previous days. Gives users the flexibility to adjust the number of minutes that the daily open range is determined by. I personally use the first 30 minutes, but adjust at your discretion.
Another GOAT of a indicator. I don't use as much as my monthly open inidcator but for trading lower time frames, this allows the user to easily set their bias for the day and extremely simple to build a strategy around.

Weekly Open Range - TatoshiDisplays a weekly open range for both current and previous weeks. Gives users the flexibility to adjust the number of hours that the weekly open range is determined by. I personally use the first 3 hours, but play around with it.
A GOAT of a indicator, allows the user to easily set their bias for the week and extremely simple to build a strategy around.

Monthly Open Range - TatoshiDisplays a monthly open range for both current and previous months. Gives users the flexibility to adjust the number of hours that the monthly open range is determined by. I personally use the first 10 hours, but play around with it.
A GOAT of a indicator, allows the user to easily set their bias for the month and extremely simple to build a strategy around.

SenxseAiSenxseiAI is a fully modular, multi-framework trading system designed for precision, clarity, and ease of use.
This tool blends market structure, dynamic S/R mapping, trend-logic, and session-based liquidity levels into a unified visual workflow. It highlights real-time entry signals with clean rays and labeled flags, while optional session, daily, and weekly highs/lows anchor traders to key liquidity points. A comprehensive theme engine—with multiple color packs and custom overrides—allows the interface to adapt to any chart style or user preference.
The UI is intentionally minimal, using toggle-based controls instead of overwhelming parameter lists, making the script beginner-friendly while maintaining professional depth.

DANCE WITH WOLVES VN ALL TO 1DANCE WITH WOLVES VN is a smart-money volume indicator designed for stocks and crypto.
Main features:
• logic to detect Distribution, No Demand, Absorption and Exhaustion.
• Automatically builds smart Support/Resistance zones from high-volume price leaders.
• Regression trend channel to see the short-term trend and trading range.
• Dashboard table that shows the top high/low price bars with buy/sell volume and group labels.
• Alert conditions for Breakout above resistance and At Support Area so you don’t need to watch the chart all the time.
You can use it on any symbol and timeframe. Just add the script to your chart and follow the zones (red = resistance, green = support) together with the P/L labels and the status line.
Smart Money Volume + Support/Resistance + Trend Channel.
Tự động vẽ vùng hỗ trợ/kháng cự theo volume mạnh/yếu, label (Distribution, No Demand, Absorption, Exhaustion) và kênh xu hướng.
Cách dùng:
Uptrend: ưu tiên mua ở gần cạnh dưới kênh hoặc vùng hỗ trợ.
Downtrend: ưu tiên bán/short ở gần cạnh trên kênh hoặc vùng kháng cự.
Sideway: đánh range – mua gần support, bán gần resistance, cẩn thận false break.
P… = vùng giá cao → nhìn kiếm setup chốt lời / short / tránh FOMO.
L… = vùng giá thấp → nhìn kiếm setup bắt nhịp hồi / entry buy an toàn hơn.

DTR SL-TPDTR SL-TP is a simple risk-management indicator designed to automatically plot stop-loss and take-profit levels based on the current market price. It helps traders visualize their risk-to-reward setup directly on the chart, making trade planning faster and more consistent.
The indicator uses two main inputs: a Stop Loss Percentage and a Take Profit Multiplier. The stop loss is calculated by reducing the current price by the chosen percentage. The take profit level is set by multiplying that same percentage by the Take Profit Multiplier and adding it to the current price. This creates a dynamic stop-loss and take-profit pair that updates with every candle.
The stop-loss line is plotted in red, and the take-profit line is plotted in green for immediate visual clarity. Traders can adjust the percentage and multiplier to match their personal risk tolerance or strategy requirements.
DTR SL-TP is useful for any style of trading that requires predefined exit levels, including scalping, day trading, and swing trading. It helps maintain discipline, enforce consistent risk management, and quickly evaluate whether a potential trade offers an acceptable reward-to-risk ratio.

DANCE WITH WOLVES VN ALL TO 1DANCE WITH WOLVES VN is a smart-money volume indicator designed for stocks and crypto.
Main features:
• logic to detect Distribution, No Demand, Absorption and Exhaustion.
• Automatically builds smart Support/Resistance zones from high-volume price leaders.
• Regression trend channel to see the short-term trend and trading range.
• Dashboard table that shows the top high/low price bars with buy/sell volume and group labels.
• Alert conditions for Breakout above resistance and At Support Area so you don’t need to watch the chart all the time.
You can use it on any symbol and timeframe. Just add the script to your chart and follow the zones (red = resistance, green = support) together with the P/L labels and the status line.
Vietnamese note: Indicator dùng volume + để vẽ vùng hỗ trợ/kháng cự thông minh, label phân phối / hấp thụ / cạn lực bán và kênh xu hướng. Dùng được cho cả stock và crypto. tot nhat dung khung 5 den 15 phut

Byrd Combo Indicator v2.5Simplify your trading with the Byrd Combo Indicator — a professional, all-in-one trading tool designed to identify high-probability bullish and bearish patterns across multiple timeframes. Whether you’re a position trader, swing trader, or intraday trader, this indicator automatically analyzes trend strength, momentum, and volume to deliver clear, actionable signals — no complex calculations required.
Key Features:
Detects strong bullish and bearish candlestick patterns automatically.
Works on multiple timeframes: from intraday charts to weekly charts.
Includes dynamic signal labeling and optional signal bars for easy visualization.
Filters out weak setups using advanced trend and volume analysis (fully automated).
Customizable settings for personal trading preferences.
The Byrd Combo Indicator v2.5 is perfect for traders who want a simple, actionable, and reliable tool to guide entries, exits, and overall trade management.

High/Low Sweep Dashboard Heatmap/Table (Final v4)The High/Low Sweep Dashboard v6 is a versatile TradingView indicator that analyzes the past N candles to track how many times the high, low, both, or neither levels were taken out. It provides a clear visual summary through either a table or heatmap, with percentages for each category.
Key Features:
- Toggle between Table or Heatmap display.
- User-selectable dashboard position: Upper Right or Lower Right.
- Track sweep data over a custom number of candles.
- Optional markers on the chart for when both or none of the levels are taken.
- Clear percentage breakdowns for each sweep type.
This indicator is ideal for traders who want a quick overview of high/low sweeps and candle behavior over a defined historical window.

Local Watchlist Gauge v6The Local Watchlist Gauge displays a compact monitoring table for a user-defined list of symbols, showing their current trend status and performance relative to their 52-week high.
The indicator presents a table that simultaneously tracks multiple symbols and displays:
• Trend direction for each symbol, determined by whether the closing price is above or below a user-defined moving average
• Percentage distance from the 52-week high, providing a clear measure of recent performance relative to the yearly peak
Each symbol is displayed with:
Trend indicator showing whether the symbol is in an uptrend (above moving average) or downtrend (below moving average)
Distance from 52-week high expressed as a percentage, with color coding to indicate proximity to recent highs
Green indicates symbols trading within 5% of their 52-week high, orange indicates symbols between 5% and 20% below their 52-week high, and red indicates symbols trading more than 20% below their 52-week high.
The table provides an at-a-glance summary of the trend status and relative performance of all symbols in the specified watchlist, allowing users to quickly identify which instruments are maintaining trend strength near their recent highs and which have experienced significant pullbacks from their yearly peaks.

XAU Power Meter + HTF FVG SystemWhat is this?
XAU Power Meter + HTF FVG System is an execution-support tool for XAUUSD that combines:
Local trend & momentum on your entry timeframe (e.g. 5m)
Volatility regime (ATR)
Higher-timeframe FVG bias (e.g. 1H)
The goal is simple: filter out low-quality trades and size up only when the market actually moves.
Core Components
1. LTF Trend (MA Stack 20 / 50 / 200)
The indicator builds a “stacked trend” using three MAs:
Bullish trend → price > MA20 > MA50 > MA200
Bearish trend → price < MA20 < MA50 < MA200
Anything else → RANGE
This gives a clean directional bias for intraday execution.
2. CCI Impulse (“Power”)
The CCI block measures the strength of the current move via |CCI| and classifies it into 4 bands:
LOW – weak momentum, usually not worth it
MEDIUM – acceptable impulse
HIGH – strong impulse
EXTREME – very strong, potential blow-off / late entry zone
These bands are used both for signal quality (Grade) and for position size guidance.
3. ATR Volatility Regime
ATR(14) is compared against its own SMA(100) to classify volatility:
QUIET – ATR < K * ATR_slow
NORMAL
ACTIVE – ATR > K * ATR_slow
You don’t want to size up in a dead market. ATR regime is used inside the Grade calculation.
4. Grade System (A / B / C / X)
The indicator compresses Trend + CCI + ATR into a single Grade:
A – In trend, strong impulse (HIGH/EXTREME), active volatility → top setups
B – In trend, at least MEDIUM impulse, acceptable volatility → good setups
C – In trend, but weaker conditions → borderline, be selective
X – Out of trend or no momentum → avoid
Internally, execution signals require Grade ≥ B for two bars in a row, to avoid one-bar “fake” spikes.
5. HTF FVG Bias (e.g. 1H)
On a higher timeframe (default: 1H), the script runs a Fair Value Gap engine with:
EMA 50/200 trend filter
ATR-based body filter (minimum candle strength)
Wilder ADX filter (trend strength)
Deep retest requirement inside the FVG zone
Optional zone auto-expiry and delete-on-use
It returns:
BUY (bullish HTF FVG confirmed)
SELL (bearish HTF FVG confirmed)
NONE (no valid zone active)
You can control how strict this bias is used via a “Strict: require active HTF FVG for entry” checkbox:
Strict OFF (default) → HTF bias can block trades against a strong HTF signal, but allows trades when HTF is neutral.
Strict ON → LTF entries are allowed only when HTF has an active FVG in the same direction (very selective).
HTF events are shown on the chart as HTF BUY / HTF SELL markers.
Execution Signals (LTF LONG / SHORT)
On your entry timeframe (e.g. 5m), the script generates LONG / SHORT arrows when:
Trend is clearly bullish or bearish (MA stack aligned),
Grade ≥ B for two consecutive bars,
HTF bias conditions are satisfied (depending on the strict mode).
These arrows are not a full auto-strategy, but a high-quality execution cue:
“Trend OK + Momentum OK + Volatility OK + HTF not against you.”
Dashboard
A compact dashboard in the corner shows, in real time:
Trend – UP / DOWN / RANGE (20/50/200 stack)
Impulse (CCI) – LOW / MEDIUM / HIGH / EXTREME
Volatility (ATR) – QUIET / NORMAL / ACTIVE
Size Multiplier – suggested risk sizing factor based on impulse
Grade – A / B / C / X
HTF FVG – BUY / SELL / NONE
This lets you sanity-check the context before pressing the button, not after the loss.
Recommended Use
Instrument: XAUUSD
Timeframe: 5m (scalping / intraday), but can be tested on 15m/1H as well
HTF: 1H by default (can experiment with 4H)
Focus on:
Grade A/B only
Strict mode ON for more institutional, fewer but higher-quality trades
Size up only when both impulse and volatility are supportive
Disclaimer
This script is a decision-support tool, not financial advice and not a guarantee of profit.
Always forward-test, understand the logic, and use your own risk management.

Adaptive Support and Resistance LevelsAdaptive Support and Resistance Levels
This indicator is a comprehensive institutional-grade trading tool designed to visualize Auction Market Theory (AMT), Support and Resistance concepts directly on the price chart. It is built for traders who require a deep understanding of market structure without the visual clutter of standard retail indicators.
Key Features:
1] Fractal Adaptive Engine:
The indicator automatically adjusts its calculations based on your timeframe.
-Intraday (1m-15m): Displays Daily Levels.
-Swing/Positional (30m-1H): Displays Weekly Levels.
-Long Term (Daily+): Displays Monthly Levels.
2]Untested Levels:
-Identifies levels from previous sessions that have not been tested by price.
-Extends these levels forward as "Magnets" until price touches them.
-Touch-Delete Logic: Once price interacts with a magnet, the line is automatically removed to keep the chart clean.
3] Institutional Dashboard:
- A "Flight Deck" table in the top-right corner provides real-time metrics:
-Context: Are we inside, above, or below the previous value zone?
-Auction State: Is the current market balanced or imbalanced?
-IB Status: Initial Balance (first 60 mins) breakout/breakdown status.
-Fuel Gauge: Measures current range vs. ADR (Average Daily Range) to gauge exhaustion.
-Volume Flow: Detects high-aggression volume relative to the average.
How to Use:
Trend Following: Look for price breaking out of the (Static Lines) , Pullback rejection, Rejection from the lines.
Reversion: Use the lower lines for bulls reversal and Upper lines for bears reversal ( Kind of reversal candle formation )
Risk Management: Use the ADR Fuel Gauge to avoid buying extended markets (>100% ADR).
Disclaimer: This tool is only for educational and analytical purposes only. Not any recommendation.

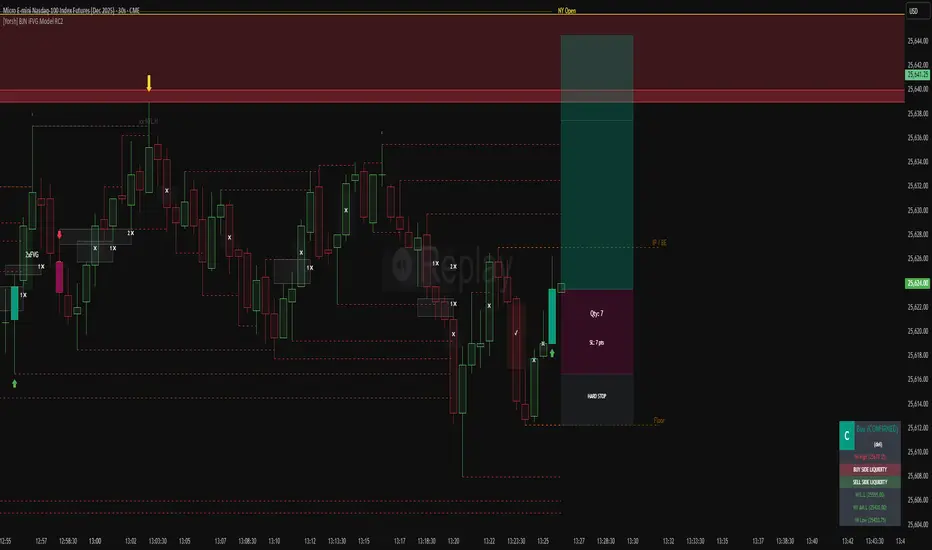
[Yorsh] BJN iFVG Model RC1 BJN iFVG Model - Mechanical Trading System
Description:
The BJN iFVG Model is not just an indicator; it is a full-scale, semi-automated trading architecture designed to mechanically execute the specific "BJN" Inverted FVG strategy.
Designed for precision traders operating on Lower Timeframes (1m to 5m), this script eliminates the cognitive load of manual analysis. It automates every single step of the mechanical model—from Higher Timeframe narrative building to tick-perfect structural validation and risk calculation.
This tool transforms your chart into a professional trading cockpit, split into three intelligent engines:
1. The Matrix (Context Engine)
Before looking for an entry, you must understand the narrative. The Matrix handles the heavy lifting of multi-timeframe analysis without cluttering your chart:
Real-Time Delivery State: Automatically detects if price is reacting from valid HTF PD Arrays (1H, 4H, Daily) to confirm a "Delivery" state.
Liquidity Sweeps: Tracks Fractals across three dimensions (1H, 15m, and Micro-Structure) to identify liquidity raids instantly.
Advanced SMT Divergence: A built-in, multi-mode SMT engine scans for correlation breaks (Pivot SMT, Adjacent Wick SMT, and FVG SMT) between NQ/ES (or custom tickers) in real-time.
Time & Macro Tracking: Automatically visualizes Killzones and highlights high-probability Macro windows.
2. The Executioner (Entry Engine)
Once the context is set, the Executioner handles the specific Inverted FVG (iFVG) entry model with strict mechanical rules:
Structural Integrity: Automatically identifies the Invalidation Point (IP), Floor/Ceiling, and Break-Even levels for every setup.
Hazard Detection: The script proactively scans the "Trading Leg" for opposing unmitigated FVGs (Hazards). If the path isn't clean, the trade is flagged or invalidated.
Composite Logic: Intelligently merges "noisy" price action into Composite FVGs to reduce false signals.
Integrated Position Sizer: When a trade is confirmed, a visual box appears showing your precise Entry, Stop Loss, Hard Stop, and Take Profit levels, along with a calculated Contract Quantity based on your risk tolerance.
3. The Ranking System (Quality Control)
Not all trades are created equal. This system grades every single confirmed setup in real-time based on confluence factors:
Grades: Ranges from A++ (Perfect Confluence) to C (Low Probability).
Confluence Check: Checks for Delivery, Sweeps (HTF/LTF), SMT, and Macro alignment at the exact moment of the trigger.
Live Status Panel: A dashboard on your chart displays the current live trade status (Armed, Triggered, Confirmed) and its Rank, so you never miss a beat.
Optimization & Performance
Trading on the 1-minute timeframe requires speed. This script has been rigorously optimized for high-frequency environments:
Smart Garbage Collection: The script manages its own memory, cleaning up old data arrays to prevent lag, ensuring the chart remains fluid even after days of data accumulation.
Tunnel Vision: Calculations are strictly focused on the relevant trading leg, ignoring historical noise to maximize execution speed.
Zero-Repaint: All historical analysis is strictly non-repainting to ensure backtesting reliability.
How to Use
Timeframes: Optimized for 1m, 2m, 3m, 4m, 5m execution.
Alerts: Configure the robust alert system to notify you only when setups meet your standards (e.g., "Alert only on Rank B+ or higher").
Strategy: Wait for the Status Panel to show a "CONFIRMED" signal. Use the on-screen Position Sizer to execute the trade with the displayed risk parameters.
Stop analyzing; start executing. Welcome to mechanical trading.
----------------------------------------------------------------------------------------------------------------
RISK DISCLAIMER:
The content, tools, and signals generated by this script are strictly for educational and informational purposes only. This script does not constitute financial advice, investment recommendations, or a solicitation to buy or sell any securities, futures, or other financial instruments.
Trading financial markets involves a high degree of risk and is not suitable for all investors. The "Position Sizer" and "Trade Setups" displayed are hypothetical simulations designed to demonstrate the mechanics of the BJN methodology; they do not guarantee future performance.
Use this tool at your own risk. The author assumes no responsibility or liability for any trading losses or damages incurred in connection with the use of this script. Always consult with a qualified financial advisor and practice proper risk management.
MSS(5m) + HTF(1h) OB & Sweep Strategy (heuristic) v6My first (hopefully) working strategy. Have fun printing guys

Yash RSI Bars - timeframe alartOnly bar coloring - No extra plots or lines
✅ Custom timeframe - Colors bars based on RSI from your selected timeframe
✅ White bars - When RSI is above overbought level (default 70)
✅ Yellow bars - When RSI is below oversold level (default 30)
✅ No color - When RSI is in neutral zone
✅ Overbought → Normal - Alert fires when white bars stop and RSI falls back below 70
✅ Oversold → Normal - Alert fires when yellow bars stop and RSI rises back above 30
✅ No alert on entry - Only alerts when bars return to normal/no color
Add the indicator to your chart
Click the bell icon ⏰ on the indicator
Select which alerts you want:
"RSI: Overbought to Normal"
"RSI: Oversold to Normal"
Choose: Notify, Email, SMS, or Webhook

Yash RSI Bars - Multi Timeframersi time frame testing
Only bar coloring - No extra plots or lines
✅ Custom timeframe - Colors bars based on RSI from your selected timeframe
✅ White bars - When RSI is above overbought level (default 70)
✅ Yellow bars - When RSI is below oversold level (default 30)
✅ No color - When RSI is in neutral zone
Clean and simple! 🎯

crab波动区间根据4W\1D\1W数据波动显示当前压力和支撑位
Display current support and resistance levels based on 4W, 1W, and 1D data volatility.

TTF (Triple Time Frame) [v1.0]The Triple Time Frame (TTF) is a tool to try and catch reversals. It looks at multiple (>2) time frames and prints a signal when RSI is >70 (overbought) and RSI is <30 (oversold).
2025 © TXL under the MIT license

Superstack 5m/15m/1hr/4hr Oversold conditionThis indicator included the 5m/15m/1h/4h oversold condition

Morning ORB FVG Trigger✅ Overview
Morning ORB FVG Trigger is a complete intraday trading framework built around:
A Morning Opening Range Breakout (ORB)
The first Fair Value Gap (FVG) after that breakout
Strict risk management and position sizing
Optional HTF trend filter (Daily / Weekly / Monthly)
Optional Daily ATR filter to avoid extreme days
The script is designed for futures / indices / FX on intraday charts up to 15 minutes and for traders who want a clean, mechanical entry framework with clear risk.
🧠 Core idea
Define a morning opening range (e.g. 09:30–09:45).
Wait for a clean breakout above/below that range.
After the breakout, wait for the first FVG in breakout direction,
confirmed by the next candle (no immediate full reclaim).
Use a chosen stop logic + R:R factor to build risk/reward boxes.
Calculate position size based on your account risk.
(Optional) Only take trades:
In the direction of the HTF EMA trend (D/W/M).
On days where the morning range is within a band of the Daily ATR.
You can also disable all signals/boxes and use the script just as a visual ORB tool.
⏰ 1. ORB / Morning Range
Inputs (Main section)
Morning Range Session
Time window of the opening range in exchange time
Example: 09:30–09:45 for a 15-minute ORB.
You can type custom ranges (e.g. 09:30–09:35 for a 5-minute ORB).
Risk/Reward (TP factor)
Multiplier for the take-profit distance relative to the stop.
2.0 = TP is 2× the stop distance
1.5 = TP is 1.5× the stop distance
Show ORB range
If enabled, draws:
ORB high/low lines
ORB labels (e.g. 15min ORB high / low)
Optional midline
Extend ORB lines to the right (bars)
How many bars to extend the ORB high/low horizontally beyond the ORB itself.
Trade box width (bars)
Horizontal width (in bars) of:
Red risk box (entry–stop)
Green reward box (entry–TP)
Implementation details
The ORB is always calculated on 1-minute data internally, so it stays precise even on 5m/15m charts.
The script only works on intraday timeframes up to 15 minutes.
📦 2. FVG Block
Group: “FVG”
Threshold %
Minimum size of an FVG in % of price.
0 = every FVG
Higher values = only larger gaps
Auto threshold (from volatility)
If enabled, the minimum FVG size is derived from historical volatility
instead of a fixed percentage.
Allow breakout FVG partly inside ORB
Off (default): the FVG must lie fully outside the ORB.
On: the breakout FVG itself may still overlap the ORB a bit,
as long as it is the first one attached to the breakout move.
Enable FVG entry signals, boxes & alerts
On: full system – FVG detection, entry labels, risk/TP boxes, alerts.
Off: no entries, no risk/TP boxes, no alerts.
You only get the ORB and (optionally) the HTF dashboard, so you can trade your own setups.
Entry mode
Entry mode (Mid / Edge / NextOpen)
Mid – Entry at the midpoint of the FVG.
Edge – Long at the upper FVG edge, short at the lower FVG edge.
NextOpen – No limit order in the gap. Entry is placed at the next bar open after FVG confirmation.
Edge offset (ticks)
Additional offset for Edge entries:
Long:
+ticks = a bit above the FVG (more conservative)
-ticks = deeper into the FVG (more aggressive)
Short:
+ticks = a bit below the FVG
-ticks = deeper into the FVG
FVG detection logic
Uses a LuxAlgo-style 3-candle FVG pattern (gap between candle 1 and 3).
Only one FVG is taken: the first valid FVG after the ORB breakout in breakup direction.
The FVG candle is the middle bar; the script:
Detects the FVG on the previous bar.
Waits for the current bar to confirm it:
Bullish: current low must stay above the lower FVG boundary
Bearish: current high must stay below the upper FVG boundary
Only then an entry signal is generated.
🛑 3. Stop Logic
Group: “Stop Logic”
Stop mode (PrevBar / Pivot / FVG Candle)
PrevBar – Stop at the low/high of the candle before the FVG
(tight/aggressive).
FVG Candle – Stop at the low/high of the FVG candle itself
(medium).
Pivot – Stop at the most recent swing high/low
using pivotLeft / pivotRight pivots (more conservative).
Ticks (stop buffer)
Offset (in ticks) from the selected stop level.
> 0 = further away (more room, more risk)
< 0 = closer (tighter stop)
Pivot left / Pivot right
Number of candles left/right to define a swing high/low
when using Pivot stop mode.
Typical intraday values: 2–3.
The script also sanity-checks the stop:
if the calculated stop would be invalid (e.g. above entry in a long), it moves it by a minimal distance (2 ticks) to keep a valid risk.
📈 4. HTF Trend Filter (Daily / Weekly / Monthly)
Group: “HTF Trend Filter”
Enable HTF trend filter
If enabled, trades are only allowed:
Long when at least 2 of D/W/M closes are above their EMA
Short when at least 2 of D/W/M closes are below their EMA
EMA length (D/W/M)
EMA length for all three higher timeframes (Daily, Weekly, Monthly).
This helps focus entries in the direction of the dominant higher-timeframe trend.
📊 5. ATR Filter (Daily)
Group: “ATR Filter (Daily)”
Use daily ATR filter
If enabled, the height of the ORB (ORB high – ORB low) must be within
a band of the Daily ATR to allow any signals.
Daily ATR length
ATR period on the Daily timeframe.
Min ORB size vs ATR
Lower bound:
Example: 0.3 → ORB must be at least 0.3 × Daily ATR
0.0 = no minimum.
Max ORB size vs ATR
Upper bound:
Example: 1.5 → ORB must be ≤ 1.5 × Daily ATR
0.0 = no maximum.
If the ORB is too small (choppy) or too large (exhausted move), no breakout or FVG signal will be generated on that day.
🧭 6. HTF Dashboard & Signal Labels
Group: “HTF Trend Dashboard”
Show HTF dashboard
Draws a small label at the top of the chart showing:
HTF Trend (EMA X)
D: UP/FLAT/DOWN
W: UP/FLAT/DOWN
M: UP/FLAT/DOWN
Dashboard position
Top Right, Top Center, Top Left – places the dashboard at the top.
Over Risk Info – no top dashboard; instead, the HTF trend info is shown as a label near the risk box when a new signal appears.
Lookback (bars) for top anchor
How many bars to use to determine the top price level for dashboard placement.
Show HTF trend above risk box on signal
Only relevant if Dashboard position = Over Risk Info.
When enabled, a small HTF label appears near the risk box for each new trade.
Signal label vertical offset (ticks)
Vertical spacing between risk info label and HTF label.
Minimum spacing HTF/Risk (ticks)
Ensures a minimum vertical distance so the two labels don’t overlap.
HTF signal label X offset (bars)
Horizontal offset (left/right) relative to the risk info label.
⏳ 7. ORB–FVG Filters (Session & Time Window)
Group: “ORB FVG Filter”
Only same session day
If enabled, FVG entries are only allowed on the same calendar day
as the ORB. When the date changes, all state & drawings are reset.
Limit hours after ORB
Enables a time window after the ORB end.
Trading window after ORB (hours)
Length of that window in hours.
Example: 2.0 → FVG signals only in the first 2 hours after ORB end.
💰 8. Risk Management & Position Sizing
Group: “Risk Management”
Calculate position size
If enabled, the script computes suggested mini and micro contract size for you.
Account size
Your trading account size (in account currency).
Risk mode
Percent – risk is a % of account size (Account risk %).
Fixed amount – risk is a fixed dollar amount (Fixed risk ($)).
Account risk %
Risk per trade as a percentage of account size (e.g. 1.0 for 1%).
Fixed risk ($)
Fixed risk per trade in dollars when using Fixed amount mode.
Micro factor (vs mini)
How much a micro contract is worth relative to a mini.
Example:
0.1 → one micro moves 1/10 of one mini.
Risk Info label
For each new trade, a label is shown above the boxes with:
Stop distance in price and $ risk per mini
Max risk allowed for the trade
Suggested mini and micro size
Text like:
Suggested: 2 mini
Suggested: 5 micro
or Suggested: no trade
This makes the script especially useful for prop-firm rules or strict risk discipline.
🎨 9. Visual Style (Boxes, Labels, ORB Lines)
Group: “Box & Label Style (Trade)”
Label font size (Very small, Small, Normal, Large)
Entry label BG / text color
Stop label BG / text color
TP label BG / text color
Risk info BG / text color
Risk box color (entry–stop zone)
Reward box color (entry–TP zone)
Group: “ORB Style”
ORB high line color
ORB low line color
ORB line width
ORB label font size
ORB label background color
ORB label text color
Show ORB midline
ORB midline color / width / style (Solid / Dashed / Dotted)
⚠️ 10. Alerts
Group: “Alerts”
The script defines three alert conditions:
Long entry FVG breakout
Triggered when a new long signal appears.
Short entry FVG breakout
Triggered when a new short signal appears.
FVG entry (long/short)
Generic alert for any new signal (long or short).
To use them:
Add the indicator to the chart.
Open the Alerts dialog → “Condition”.
Select this script and one of the alert conditions.
Set your preferred expiration and notification settings.
Alerts only fire when Enable FVG entry signals, boxes & alerts is on.
🧩 11. How the trading logic flows (summary)
Build ORB on 1-minute data during the selected session.
Optionally reject the day if ORB is outside the ATR bounds.
Wait for a breakout (close above high or below low), respecting HTF trend filter.
After breakout, look for the first valid FVG in that direction:
Outside the ORB (unless breakout FVG allowed inside)
Confirmed by the next candle (no full reclaim)
Once confirmed:
Compute entry, stop, target.
Draw risk/reward boxes and all labels.
Optionally show HTF signal label over the risk info.
Trigger alerts if enabled.
If you disable FVG signals, only steps 1–3 (plus dashboard) are effectively active.
⚠️ 12. Notes & Disclaimer
Script is intended for intraday trading up to 15-minute timeframes.
All signals are mechanical and do not guarantee profitability.
Always backtest and forward-test on your own data before risking real money.
This script is for educational purposes only and is not financial advice.
🚀 Quick-start guide
Add the script to your chart
Use an intraday timeframe ≤ 15 minutes (1m, 3m, 5m, 15m).
Works best on liquid indices, futures, FX and large-cap stocks.
Set the Morning Range
In “Morning Range Session” choose the exchange’s opening window.
Examples
US index futures (CME): 08:30–08:45 or 08:30–08:35
US stocks (NYSE/Nasdaq): 09:30–09:45 or 09:30–09:35
The ORB is always calculated on 1-minute data internally, so the range stays accurate on higher intraday charts.
Keep the default filters at first
HTF Trend Filter: ON
EMA length = 20
This will only allow trades in the direction of the dominant D/W/M trend.
ATR Filter: OFF (optional; you can enable later once you’re comfortable).
Use the full trade system
In the FVG group leave
“Enable FVG entry signals, boxes & alerts” = ON
Entry mode: Mid
Stop mode: FVG Candle or PrevBar
Risk/Reward: 2.0 as a starting point.
Set your risk
Turn on “Calculate position size”.
Enter your Account size and choose either:
Risk mode = Percent (e.g. 1.0 = 1% per trade), or
Risk mode = Fixed amount (e.g. $250 per trade).
The risk info label will show:
Stop distance in price and $/contract
Max allowed risk
Suggested mini and micro contract size.
Enable alerts (optional)
Open the Alerts dialog → Condition: this script.
Choose one of:
Long entry FVG breakout
Short entry FVG breakout
FVG entry (long/short)
Choose “Once per bar” or “Once per bar close”, and your preferred notification type.
Replay & journal
Use the TradingView bar replay tool to step through past days.
Focus on:
How the ORB defines the structure.
How the first confirmed FVG outside the ORB behaves.
Whether the risk/TP levels fit your own style and product.
🎛 Recommended settings & profiles
These are starting points, not rules. Always adapt to the instrument and your own risk tolerance.
1. Conservative / Trend-following
Timeframe: 5m or 15m
Morning Range Session: 15-minute ORB around the cash or futures open
FVG
Threshold %: 0.05–0.1 (filter out very small gaps)
Auto threshold: OFF (keep it simple)
Allow breakout FVG partly inside ORB: OFF
Enable FVG entry signals/boxes/alerts: ON
Entry mode: Mid
Stop Logic
Stop mode: Pivot
Pivot left/right: 2–3
Stop buffer: +1–2 ticks
HTF Trend Filter
Enabled: ON
EMA length: 20
ATR Filter
Enabled: ON
Daily ATR length: 14
Min ORB vs ATR: 0.3–0.4
Max ORB vs ATR: 1.2–1.5
Risk Management
Risk mode: Percent
Account risk: 0.5–1.0%
Idea: Only trade when the higher-timeframe trend supports the move and the opening range is of a “normal” size for the current volatility.
2. Balanced / Intraday directional
Timeframe: 3m or 5m
FVG
Threshold %: 0.02–0.05
Auto threshold: ON (lets the script adapt to volatility)
Allow breakout FVG partly inside ORB: ON
(first breakout FVG may partly sit inside the ORB)
Entry mode: Edge
Edge offset (ticks): 0 or +1
Stop Logic
Stop mode: FVG Candle
Stop buffer: 0–1 ticks
HTF Trend Filter
Enabled: ON
ATR Filter
Enabled: OFF (optional)
Risk Management
Risk mode: Percent
Account risk: 1.0–1.5% (if this fits your plan)
Idea: Slightly more aggressive entries at the gap edge, still aligned with HTF trend, but with more flexibility on ATR.
3. Aggressive / Scalping around the ORB
Timeframe: 1m or 3m
FVG
Threshold %: 0.0–0.02
Auto threshold: ON
Allow breakout FVG partly inside ORB: ON
Entry mode: NextOpen or Edge with a negative offset (deeper into the gap)
Stop Logic
Stop mode: PrevBar
Stop buffer: 0 or -1 tick
HTF Trend Filter
Enabled: OFF (or ON but treat as soft guidance)
ATR Filter
Enabled: OFF
Risk Management
Risk mode: Percent
Account risk: lower, e.g. 0.25–0.5% per trade
Idea: More trades and tighter stops. Best for experienced traders who understand the limitations of scalping and whipsaw risk.
Final reminder
All of these are templates, not guarantees:
Always check how the system behaves on your market and session.
Start on replay and demo before trading real money.
Adjust filters (HTF, ATR, thresholds) until the signals fit your personal approach.

HTF Entry Model+ [#] by @shulktradesHTF Entry Model+ by @shulktrades
Overview
The HTF Entry Model+ is a multi-timeframe trading indicator that identifies algorithmic signatures in price action and automatically displays complete entry setups with risk-to-reward projections. When specific order flow patterns are detected on a higher timeframe, the indicator calculates and displays entry zones, stop loss placement, and multiple profit targets - giving traders a complete trade plan before price reaches the entry level.
What This Indicator Does
Identifies Algorithmic Price Patterns
The indicator monitors a higher timeframe to detect specific signatures in price action that signal potential reversals or continuations. These patterns represent moments when institutional order flow creates measurable shifts in market dynamics.
Key Points:
- Analyzes higher timeframe price structure continuously
- Detects order flow signatures that precede directional moves
- Confirms patterns only when specific conditions are met
- Filters out low-quality signals automatically
Projects Complete Entry Models
When a valid pattern is detected, the indicator immediately calculates and displays a full trade setup with all necessary levels clearly marked on your chart.
What Gets Displayed:
- Entry zone (optimal price area to enter the trade)
- Stop loss level (where to exit if wrong)
- Multiple profit targets (1:1, 1:2, 1:3, 1:4, 1:5, 1:6, 1:7)
- OTE levels (Optimal Trade Entry zone & OTE + take profit model)
- Risk-reward ratios for each target
Adapts to Your Timeframe
The indicator intelligently selects an appropriate higher timeframe based on your current chart, or you can manually choose which timeframe to analyze.
Timeframe Relationships:
- 1-5 minute charts → analyzes 15-60 minute structure
- 15-30 minute charts → analyzes 4-hour structure
- 1 hour charts → analyzes daily structure
- 4 hour charts → analyzes weekly structure
- Daily charts → analyzes monthly structure
How Traders Use This Indicator
Step 1: Wait for Setup Detection
The indicator runs in the background, continuously scanning the higher timeframe for algorithmic signatures. When detected, a horizontal marker appears at the pattern formation level.
Step 2: Review the Entry Model
Once confirmed, the complete risk-reward projection displays instantly:
- All entry and exit levels are clearly labeled
- Stop loss shows exactly where the setup invalidates
- Multiple targets allow for systematic profit-taking
- Color coding shows bullish (green) or bearish (red) direction
Step 3: Plan Your Trade
Before price retraces to the entry zone, you have complete information:
- Know your exact entry price levels
- Know your exact stop loss placement
- Know multiple profit target levels
- Calculate position size based on the risk shown
Step 4: Execute When Price Returns
Wait for price to retrace back into the entry zone (OTE levels), then execute your trade with predefined parameters.
Step 5: Manage According to the Model
Use the displayed targets to manage your position:
- Scale out partial profits at each target level
- Move stops to breakeven after first or second target
- Let remaining position run toward extended targets
Key Features
Smart Pattern Recognition
- Detects specific algorithmic signatures that precede high-probability moves
- Validates patterns using proprietary order flow analysis
- Filters signals based on market structure quality
- Reduces false signals in choppy or ranging conditions
Complete Risk-Reward Framework
- Entry zones marked with "OTE" labels at optimal prices
- Stop loss clearly labeled at pattern invalidation point
- Seven profit targets (1:1 through 1:7 risk-reward)
- Additional reference levels for advanced trade management
Liquidity-Based Validation
- Monitors higher timeframe liquidity dynamics
- Identifies when stops are likely being hunted
- Confirms setups that follow liquidity sweeps
- Distinguishes high-quality from lower-quality signals
Session Time Filtering
- Optional time-based filtering for entry model display
- Set specific trading hours when setups should appear
- Useful for focusing on active market sessions
- Can be disabled for swing trading or higher timeframes
Clean Visual Presentation
- Color-coded setups (green for bullish, red for bearish)
- Clearly labeled levels (Entry, Stop Loss, OTE, 1:1, 1:2, etc.)
- Minimal chart clutter - only active setups display
- All historical setups remain visible for backtesting
Configuration Options
Higher Timeframe Settings
- Auto Mode: Automatically selects optimal higher timeframe for your chart
- Fixed Mode: Manually choose any specific timeframe to analyze
- Provides flexibility for different trading strategies and preferences
Visual Customization
- Bullish Color: Choose color for long setups (default: green)
- Bearish Color: Choose color for short setups (default: red)
- Display Length: Adjust how far forward the levels project
- Clean, professional appearance on any chart theme
Time Filter Options
- Enable/Disable Toggle: Turn session filtering on or off
- Entry Timeframe: Specify exact trading hours for setup display
- Recommended Usage: Enable for day trading, disable for swing trading
- Timezone adjustable to match your market hours
Who This Indicator Is For
Day Traders & Scalpers
- Get precise entry timing on intraday timeframes
- Clear stop placement for tight risk management
- Multiple targets for scaling out positions
- Session filtering helps focus on active market hours
Seconds Timeframe
5m Timeframe
Swing Traders
- Higher timeframe analysis for multi-day positions
- Structured entry and exit planning
- Extended targets for longer-term moves
- Can disable time filtering for 24-hour analysis
Multi-Timeframe Traders
- Aligns entries across different timeframes
- Provides higher timeframe context automatically
- Helps identify confluence between timeframes
- Works on any liquid market (stocks, futures, forex, crypto)
Systematic Traders
- Pre-defined entry and exit levels before execution
- Consistent risk-reward framework on every setup
- Historical setups remain visible for backtesting
- Removes emotional decision-making from entries
Market Compatibility
Best Performance On:
- Futures contracts (ES, NQ, YM, CL, GC, etc.)
- Major forex pairs (EUR/USD, GBP/USD, USD/JPY, etc.)
- Liquid stocks and ETFs
- Major cryptocurrency pairs
Optimal Timeframes:
- 1-minute to 1-hour: Intraday trading and scalping
- 4-hour to Daily: Swing trading and position entries
- Works on higher timeframes but signals become less frequent
Market Conditions:
- Most effective in trending or impulsive markets
- Automatically filters lower-quality ranging setups
- Adapts to different volatility environments
- Functions across all market sessions
Important Information
What This Indicator Does NOT Do
- Does not predict future price movement
- Does not guarantee profitable trades
- Does not show internal calculation methods or specific detection criteria
- Does not display the pattern scanning process (only confirmed setups)
What Traders Should Understand
- This tool identifies potential setups based on candlestick order flow analysis
- All trading involves risk - use appropriate position sizing
- Combine with your own analysis and market understanding
- Proper risk management is essential regardless of signal quality
- Past setup performance does not guarantee future results
Standard Risk Management Guidelines
Position Sizing
- Risk only 1-2% of account capital per trade
- Use the displayed stop loss distance to calculate position size
- Adjust size smaller for lower-confidence setups
- Never risk more than you can afford to lose
Stop Loss Placement
- Always honor the displayed stop loss level
- Place stops at or slightly beyond the marked level
- Do not move stops further away if trade moves against you
- Accept the loss if stop is hit and wait for next setup
Profit Taking Strategy
- Consider scaling out at multiple target levels
- Take some profit at 1:1 to reduce risk to zero
- Let remaining position run toward extended targets
- Move stops to breakeven after first target is hit
Additional Considerations
- Be aware of overall market trend direction
- Reduce position size during uncertain market conditions
- Keep detailed records of trades taken from indicator setups
Important Trading Considerations
Price Action Variability
It is important to note that market conditions vary and price does not always retrace into the displayed entry zones. In certain market environments, particularly during strong impulsive moves or high-impact news events, price may move directly toward the projected targets without providing an opportunity to enter at the optimal entry levels. Traders should be prepared to either wait for proper entry conditions or adjust their strategy accordingly based on their risk tolerance and trading plan.
Disclaimer
Educational Purpose Only
This indicator is provided solely for educational and informational purposes. It is designed to assist traders in analyzing market structure and identifying potential trading opportunities based on technical analysis principles. The indicator does not constitute financial advice, investment advice, trading advice, or any other type of professional advice.
No Guarantee of Results
Past performance of signals and setups identified by this indicator does not guarantee future results. All trading and investing involves substantial risk of loss, and you may lose some or all of your invested capital. No representation is being made that any account will or is likely to achieve profits or losses similar to those shown or discussed.
Personal Responsibility
Users of this indicator are solely responsible for their own trading decisions and any resulting outcomes. You should conduct your own research, analysis, and due diligence before making any trading or investment decisions. Always consult with a qualified financial advisor before making investment decisions if you are uncertain about your financial situation.
Risk Warning
Trading futures, forex, stocks, and cryptocurrencies carries a high level of risk and may not be suitable for all investors. The high degree of leverage can work against you as well as for you. Before deciding to trade, you should carefully consider your investment objectives, level of experience, and risk appetite. Only trade with money you can afford to lose.
No Warranty
This indicator is provided "as is" without warranty of any kind, either expressed or implied. The developer makes no guarantees about the accuracy, reliability, completeness, or timeliness of the information, signals, or projections provided by this indicator.
---
This indicator represents proprietary research into algorithmic price behavior and order flow dynamics. The methodology is protected to preserve the effectiveness of the approach and maintain the integrity of the analysis framework.

BaraaCoOL's Multi-Timeframe Signals**BaraaCoOL's RTD - Real-Time Direction Indicator**
© BaraaCoOL 2025 | Version 1.0
**🎯 What Does This Indicator Do?**
RTD shows you the market direction across multiple timeframes in one simple dashboard. When all timeframes align, you get clear BULLISH or BEARISH signals to help you make better trading decisions.
**📊 What You See on Your Chart:**
1. **Dashboard Table** - Shows 6 timeframes (M5, M15, M30, H1, H4, D1)
- **R Row** = Momentum strength (green = bullish, red = bearish)
- **T Row** = Trend acceleration (green = accelerating up, red = accelerating down)
- **D Row** = Direction status (▲ = up, ▼ = down, ● = neutral)
- **TREND Row** = Overall signal (BULLISH/BEARISH/NEUTRAL)
2. **Colored Zones** - Show you where price is relative to trend
- Green zones = Price above trend (bullish area)
- Red zones = Price below trend (bearish area)
3. **Trend Line** - Main reference line
- Cyan color = Price is above (bullish)
- Pink color = Price is below (bearish)
4. **Signal Arrows** (optional)
- ▲ Green arrow = Potential buy signal
- ▼ Red arrow = Potential sell signal
**🔔 How to Get Alerts:**
**Quick Setup (Single Symbol):**
1. Add the indicator to your chart
2. Click the Alert button (⏰) at the top
3. Select "BaraaCoOL's RTD" → "Dashboard BULLISH/BEARISH"
4. Click Create
**For Multiple Symbols:**
1. Make a watchlist with symbols you want to monitor
2. Click Alert button (⏰)
3. In "Symbol" dropdown → Choose your watchlist
4. In "Condition" → Select "BaraaCoOL's RTD" → "Dashboard BULLISH/BEARISH"
5. Click Create
You'll get notified whenever ANY symbol in your watchlist turns BULLISH or BEARISH!
**💡 How to Trade With It:**
**Simple Strategy:**
- Dashboard shows **BULLISH** → Look for BUY opportunities
- Dashboard shows **BEARISH** → Look for SELL opportunities
- Dashboard shows **NEUTRAL** → Stay out or wait for confirmation
**Best Results:**
- Wait for the TREND row to show BULLISH or BEARISH
- This happens when M5, M15, and M30 all align in the same direction
- The stronger the alignment, the better the signal
**⚙️ Settings You Can Change:**
- **Dashboard Position** - Move it to any corner of your chart
- **Dashboard Size** - Compact (phone), Normal (desktop), Large (tablet)
- **Show/Hide Elements** - Turn on/off zones, trend line, or arrows
- **Colors** - Customize all colors to match your style
- **Sensitivity** - Adjust how fast the indicator responds to price changes
**✅ Works On:**
- All markets (Forex, Crypto, Stocks, Indices, Commodities)
- All timeframes (1-minute to Monthly)
- All trading styles (Scalping, Day Trading, Swing Trading)
**⚠️ Important:**
- Use proper risk management
- Don't risk more than you can afford to lose
- This indicator is a tool to help analysis, not a guarantee of profits
- Combine with your own analysis and strategy
**Need Help?** Send me a message on TradingView!
