Analysis Date: September 8, 2025
Current Price: 45,537
Market Session: Post-Market Analysis
---
Executive Summary
---
Quarterly Volume Profile Analysis
Institutional Positioning Intelligence
The quarterly volume profile (Q3 2025) reveals a concerning pattern typical of extended equity markets in late-cycle environments:
Primary Institutional Activity Zone: 42,000-43,500
Extension Analysis:
Resistance Structure Analysis:
Price Structure Context
Historical Pattern Recognition:
The current Dow Jones setup displays classic late-cycle equity characteristics where price has methodically ground higher above institutional accumulation zones. Unlike the catastrophic voids seen in S&P 500 and Nasdaq, YM shows a more measured extension that may be sustainable in the near term.
Relative Risk Assessment:
Sector Composition Considerations
Dow Jones Defensive Characteristics:
---

Execution Chart Technical Analysis
Current Technical Configuration - DETERIORATING MOMENTUM
DEMA Analysis - WARNING SIGNALS EMERGING:
DMI/ADX Assessment - MOMENTUM DETERIORATION:
Stochastic Analysis - OVERBOUGHT CONDITIONS:
Support and Resistance Levels
Critical Technical Levels:
---
Trading Scenarios and Setup Criteria
Scenario 1: Defensive Profit-Taking Setup (PRIMARY)
Optimal Conditions for Position Reduction:
Profit-Taking Protocol:
Scenario 2: Range-Trading Setup (SECONDARY)
Conditions for Tactical Range Trading:
Range Trading Parameters:
Scenario 3: Breakdown Short Setup (AGGRESSIVE)
Short Entry Conditions:
Short Setup Parameters:
---
Risk Management Protocols
Position Sizing Guidelines
Conservative Approach (Strongly Recommended):
Stop Loss Hierarchy
Portfolio Management Framework
Defensive Positioning Strategy:
---
Market Context and External Factors
Fundamental Considerations Affecting Dow Performance
Economic Cycle Positioning:
Sector Rotation Implications:
Technical Market Structure
Relative Performance Analysis:
---
Monitoring Checklist and Alert Levels
Daily Monitoring Requirements
Critical Alert Levels
Risk Escalation Alerts:
Defensive Action Triggers:
---
Strategic Outlook and Risk Assessment
Risk/Reward Analysis
Asymmetric Risk Profile:
Portfolio Allocation Recommendation
Allocation Framework:
---
Conclusion and Strategic Assessment
Strategic Priority: Capital preservation and systematic risk reduction while maintaining readiness for complete exit if institutional extension boundaries are violated.
Next Review: Daily monitoring of momentum indicators and institutional level approach
Position Management: Systematic profit-taking with defensive stop management
---
Important Disclaimer
Current Price: 45,537
Market Session: Post-Market Analysis
---
Executive Summary
Dow Jones presents a moderately extended equity position with manageable risk characteristics compared to other major indices. While trading above institutional accumulation levels, the extension is less severe than S&P 500 or Nasdaq, making it the least dangerous of the equity exposures. However, institutional positioning analysis reveals limited upside potential with asymmetric risk favoring defensive strategies.
---
Quarterly Volume Profile Analysis
Institutional Positioning Intelligence
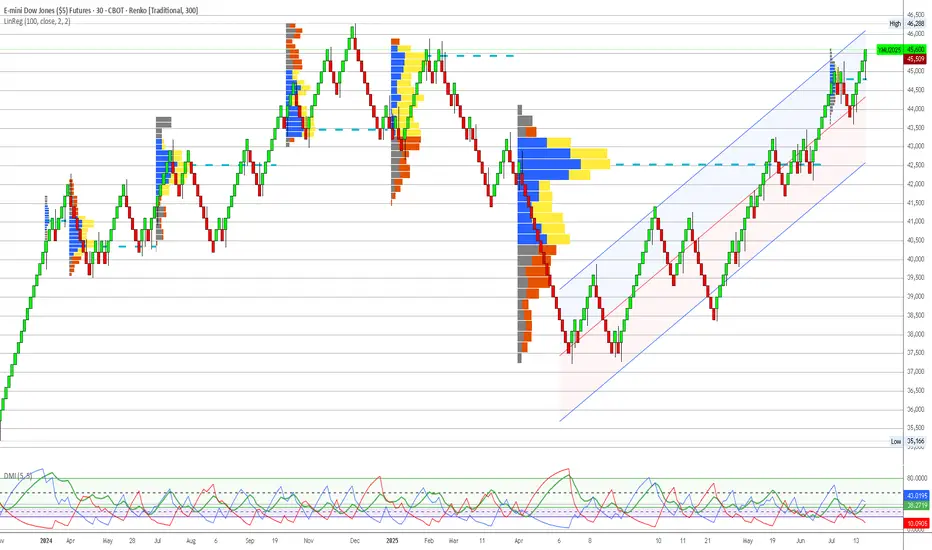
The quarterly volume profile (Q3 2025) reveals a concerning pattern typical of extended equity markets in late-cycle environments:
Primary Institutional Activity Zone: 42,000-43,500
- Moderate blue volume concentration representing historical institutional positioning
- Current price (45,537) trades approximately 2,000+ points above primary accumulation
- Volume density significantly lighter than commodity accumulation patterns
- Institutional activity appears distributed rather than concentrated
Extension Analysis:
- Core Accumulation: 42,500-43,000 (peak institutional activity)
- Extended Zone: 43,500-44,500 (moderate institutional interest)
- Current Level: 45,537 (approximately 5-7% above institutional positioning)
- Void Risk: Above 46,000 (minimal institutional support visible)
Resistance Structure Analysis:
- 45,800-46,200: Immediate resistance with mixed volume activity
- 46,500-47,000: Historical distribution zones from previous highs
- 47,500+: Complete institutional void representing extreme overextension
Price Structure Context
Historical Pattern Recognition:
The current Dow Jones setup displays classic late-cycle equity characteristics where price has methodically ground higher above institutional accumulation zones. Unlike the catastrophic voids seen in S&P 500 and Nasdaq, YM shows a more measured extension that may be sustainable in the near term.
Relative Risk Assessment:
- Manageable Extension: 5-7% above institutional levels vs 15%+ in other indices
- Blue-Chip Nature: Dow composition includes more defensive, dividend-paying companies
- Institutional Memory: Historical support levels around 42,000-43,000 well-established
- Risk Definition: Clear institutional boundaries provide defensive positioning reference
Sector Composition Considerations
Dow Jones Defensive Characteristics:
- Utilities and consumer staples providing defensive anchor
- Financial sector exposure to interest rate sensitivity
- Industrial components reflecting economic cycle positioning
- Technology weight lower than growth-focused indices
---
Execution Chart Technical Analysis
Current Technical Configuration - DETERIORATING MOMENTUM
DEMA Analysis - WARNING SIGNALS EMERGING:
- Black Line (Fast DEMA 12): Currently at 45,537
- Orange Line (Slow DEMA 20): Currently at 45,480
- Configuration: Bullish but narrowing gap indicating momentum loss
- Trend Bias: Technical momentum weakening despite bullish configuration
DMI/ADX Assessment - MOMENTUM DETERIORATION:
- ADX Level: Declining from previous highs, currently around 25-30
- +DI vs -DI: +DI losing dominance, -DI starting to gain ground
- Momentum Direction: Showing signs of exhaustion after extended advance
- Trend Strength: Weakening ADX suggests institutional conviction fading
Stochastic Analysis - OVERBOUGHT CONDITIONS:
- Tactical Stochastic (5,3,3): Overbought territory with negative divergence
- Strategic Stochastic (50,3,3): Extended levels showing momentum fatigue
- Divergence Analysis: Price making new highs while momentum indicators lag
Support and Resistance Levels
Critical Technical Levels:
- Current Resistance: 45,800 (near-term extension limit)
- Key Resistance: 46,200 (major resistance zone)
- Major Resistance: 46,800 (dangerous overextension territory)
- Immediate Support: 45,200 (DEMA cluster)
- Key Support: 44,500 (institutional extension boundary)
- Major Support: 42,500-43,000 (primary institutional accumulation)
---
Trading Scenarios and Setup Criteria
Scenario 1: Defensive Profit-Taking Setup (PRIMARY)
Optimal Conditions for Position Reduction:
- DEMA momentum loss: Gap narrowing between black and orange lines
- DMI deterioration: -DI gaining on +DI with weakening ADX
- Stochastic overbought: Both timeframes showing exhaustion signals
- Volume analysis: Declining volume on any advance attempts
- Resistance respect: Failure to break above 46,000 cleanly
Profit-Taking Protocol:
- Primary Action: Reduce positions by 50-75% at current levels
- Secondary Reduction: Complete exit on any bounce to 46,000+
- Stop Management: Trail stops using 300-point intervals
- Cash Allocation: Redirect capital to commodity opportunities
Scenario 2: Range-Trading Setup (SECONDARY)
Conditions for Tactical Range Trading:
- Defined range: 44,500-45,800 (institutional boundary to resistance)
- DEMA maintaining bullish bias within range
- Volume profile respect at key levels
- ADX below 25 indicating sideways consolidation
Range Trading Parameters:
- Long Zone: 44,500-44,800 (institutional boundary approach)
- Short Zone: 45,600-45,800 (resistance approach)
- Stop Distance: 300-450 points maximum
- Position Size: Reduced allocation (1% account risk maximum)
Scenario 3: Breakdown Short Setup (AGGRESSIVE)
Short Entry Conditions:
- DEMA bearish crossover: Black line breaking below orange line
- Support violation: Break below 44,500 institutional boundary
- Volume confirmation: Increased volume supporting breakdown
- DMI alignment: -DI gaining clear dominance over +DI
Short Setup Parameters:
- Entry Range: 44,200-44,400 on confirmed breakdown
- Stop Loss: Above 45,000 (failed breakdown)
- Targets: 43,000, 42,500, 42,000 (institutional accumulation zones)
- Risk Management: Tight stops given counter-trend positioning
---
Risk Management Protocols
Position Sizing Guidelines
Conservative Approach (Strongly Recommended):
- Maximum Risk: 1% of account (reduced from standard due to extension risk)
- Contract Calculation: Account Size × 0.01 ÷ (Stop Distance × $5)
- Example: $100,000 account with 400-point stop = 50 contracts maximum
- Rationale: Extended positioning requires defensive allocation
Stop Loss Hierarchy
- Tactical Stop: 45,000 (execution chart support cluster)
- Strategic Stop: 44,500 (institutional extension boundary)
- Emergency Stop: 43,800 (institutional accumulation approach)
Portfolio Management Framework
Defensive Positioning Strategy:
- Current Holdings: Reduce exposure by 50-75%
- New Positions: Avoid until return to institutional levels
- Capital Reallocation: Redirect to commodity opportunities (NG, CL)
- Monitoring Frequency: Daily assessment of momentum deterioration
---
Market Context and External Factors
Fundamental Considerations Affecting Dow Performance
Economic Cycle Positioning:
- Federal Reserve policy uncertainty affecting financial sector components
- Industrial sector sensitivity to economic slowdown concerns
- Consumer discretionary weakness impacting retail components
- Utility sector providing defensive characteristics in uncertain environment
Sector Rotation Implications:
- Value vs growth rotation potentially favoring Dow components
- Dividend yield advantage in higher interest rate environment
- Defensive sector weighting providing relative outperformance potential
- International exposure through multinational components
Technical Market Structure
Relative Performance Analysis:
- Outperforming S&P 500 and Nasdaq on risk-adjusted basis
- Less extended from institutional levels than growth indices
- Better volume profile support at key technical levels
- Defensive sector composition providing downside protection
---
Monitoring Checklist and Alert Levels
Daily Monitoring Requirements
- DEMA Configuration: Watch for gap narrowing or bearish crossover
- Institutional Respect: Monitor behavior at 44,500 extension boundary
- Volume Analysis: Track volume patterns on any advance attempts
- Sector Rotation: Monitor defensive vs growth sector performance
- Correlation Analysis: Track relationship with bond yields and dollar strength
Critical Alert Levels
Risk Escalation Alerts:
- DEMA bearish crossover below 45,400
- Break below 44,500 institutional extension boundary
- Volume breakdown with accelerating selling pressure
- ADX rising with -DI dominance confirming bearish momentum
Defensive Action Triggers:
- Any failure to break above 46,000 on multiple attempts
- Stochastic negative divergence with price at new highs
- Sector rotation away from Dow components toward defensives
- Federal Reserve policy announcements affecting interest rate expectations
---
Strategic Outlook and Risk Assessment
Risk/Reward Analysis
Asymmetric Risk Profile:
- Upside Potential: Limited 500-800 points to dangerous overextension
- Downside Risk: 2,000+ points to institutional accumulation zones
- Risk/Reward Ratio: Unfavorable 1:3+ downside vs upside
- Probability Assessment: Moderate (40%) for further upside, High (70%) for correction
Portfolio Allocation Recommendation
Defensive Positioning Required
Dow Jones represents the least dangerous equity exposure in current market conditions but still requires defensive management. The 5-7% extension above institutional levels, while manageable compared to other indices, suggests limited upside potential with significant correction risk. Priority should be placed on systematic profit-taking and capital reallocation to higher-conviction commodity opportunities.
Allocation Framework:
- Current Portfolio Weight: Reduce to 5-8% maximum (from previous levels)
- Entry Method: Avoid new positions until institutional level return
- Hold Period: Short-term tactical only, exit on weakness
- Exit Strategy: Systematic reduction on any bounce attempts
---
Conclusion and Strategic Assessment
Dow Jones offers the best risk profile among equity indices but remains fundamentally challenged by extension above institutional positioning. The defensive sector composition and less severe overextension provide relative safety, but the asymmetric risk profile strongly favors capital preservation over growth seeking. Current conditions warrant defensive positioning with readiness to exit entirely on any momentum deterioration.
Strategic Priority: Capital preservation and systematic risk reduction while maintaining readiness for complete exit if institutional extension boundaries are violated.
Next Review: Daily monitoring of momentum indicators and institutional level approach
Position Management: Systematic profit-taking with defensive stop management
---
Important Disclaimer
Risk Warning and Educational Purpose Statement
This analysis is provided for educational and informational purposes only and does not constitute financial advice, investment recommendations, or trading signals. All trading and investment decisions are solely the responsibility of the individual trader or investor.
Key Risk Considerations:
- Futures trading involves substantial risk of loss and is not suitable for all investors
- Past performance does not guarantee future results
- Market conditions can change rapidly, invalidating any analysis
- Leverage can amplify both profits and losses significantly
- Individual financial circumstances and risk tolerance vary greatly
Professional Guidance: Before making any trading decisions, consult with qualified financial advisors, conduct your own research, and ensure you fully understand the risks involved. Only trade with capital you can afford to lose.
Methodology Limitations: Volume profile analysis and technical indicators are tools for market assessment but are not infallible predictors of future price movement. Market dynamics include numerous variables that cannot be fully captured in any single analytical framework.
The views and analysis presented represent one interpretation of market data and should be considered alongside other forms of analysis and individual judgment.
Verbundene Veröffentlichungen
Haftungsausschluss
Die Informationen und Veröffentlichungen sind nicht als Finanz-, Anlage-, Handels- oder andere Arten von Ratschlägen oder Empfehlungen gedacht, die von TradingView bereitgestellt oder gebilligt werden, und stellen diese nicht dar. Lesen Sie mehr in den Nutzungsbedingungen.