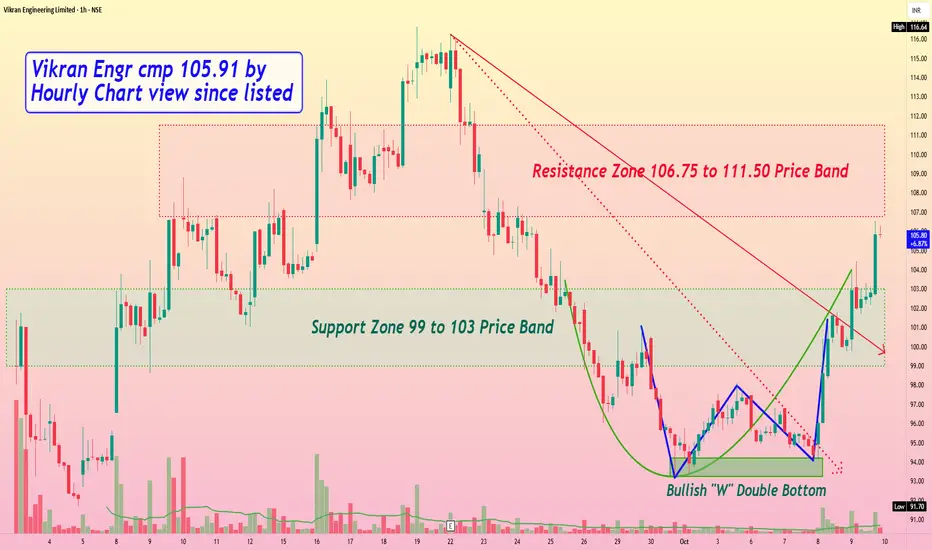
Vikran Engineering cmp 105.91 by Hourly Chart view since listed
- Support Zone 99 to 103 Price Band
- Resistance Zone 106.75 to 111.50 Price Band
- Volumes are spiking well above avg traded quantity over past few days
- Subject to closure above Resistance Zone for few days, New ATH maybe anticipated
- Stock has formed bullish technical chart setup with Rounding Bottom and W Double Bottom
Haftungsausschluss
Die Informationen und Veröffentlichungen sind nicht als Finanz-, Anlage-, Handels- oder andere Arten von Ratschlägen oder Empfehlungen gedacht, die von TradingView bereitgestellt oder gebilligt werden, und stellen diese nicht dar. Lesen Sie mehr in den Nutzungsbedingungen.
Haftungsausschluss
Die Informationen und Veröffentlichungen sind nicht als Finanz-, Anlage-, Handels- oder andere Arten von Ratschlägen oder Empfehlungen gedacht, die von TradingView bereitgestellt oder gebilligt werden, und stellen diese nicht dar. Lesen Sie mehr in den Nutzungsbedingungen.