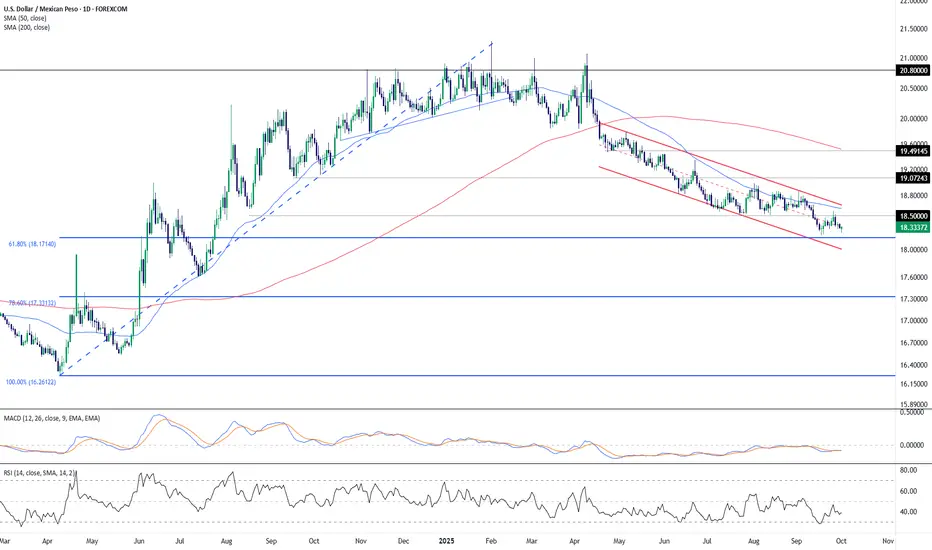
USD/MXN continues to trade within a descending channel, maintaining pressure after failing to reclaim the 50-day SMA (18.60) and staying well below the 200-day SMA (19.51). The broader trend remains bearish, with lower highs and lower lows firmly intact.
Currently, price is testing the 18.50 zone, just above the 61.8% Fibonacci retracement (18.17) of the 2023–2024 rally. This area is crucial: a decisive break below it could accelerate downside momentum, exposing the 17.33 support and possibly the 16.26 level, which marks the 100% retracement.
Momentum indicators lean bearish:
MACD remains in negative territory, showing continued downside bias.
RSI sits around 39, reflecting weak momentum but not yet oversold, leaving room for further declines.
If buyers manage to defend the 18.17–18.50 support range, a short-term bounce back toward 18.80–19.00 resistance within the channel is possible. Otherwise, a breakdown could confirm continuation of the broader downtrend.
USD/MXN remains under bearish control, with Fibonacci support now the key level to watch for a potential reaction. -MW
Haftungsausschluss
Die Informationen und Veröffentlichungen sind nicht als Finanz-, Anlage-, Handels- oder andere Arten von Ratschlägen oder Empfehlungen gedacht, die von TradingView bereitgestellt oder gebilligt werden, und stellen diese nicht dar. Lesen Sie mehr in den Nutzungsbedingungen.
Haftungsausschluss
Die Informationen und Veröffentlichungen sind nicht als Finanz-, Anlage-, Handels- oder andere Arten von Ratschlägen oder Empfehlungen gedacht, die von TradingView bereitgestellt oder gebilligt werden, und stellen diese nicht dar. Lesen Sie mehr in den Nutzungsbedingungen.