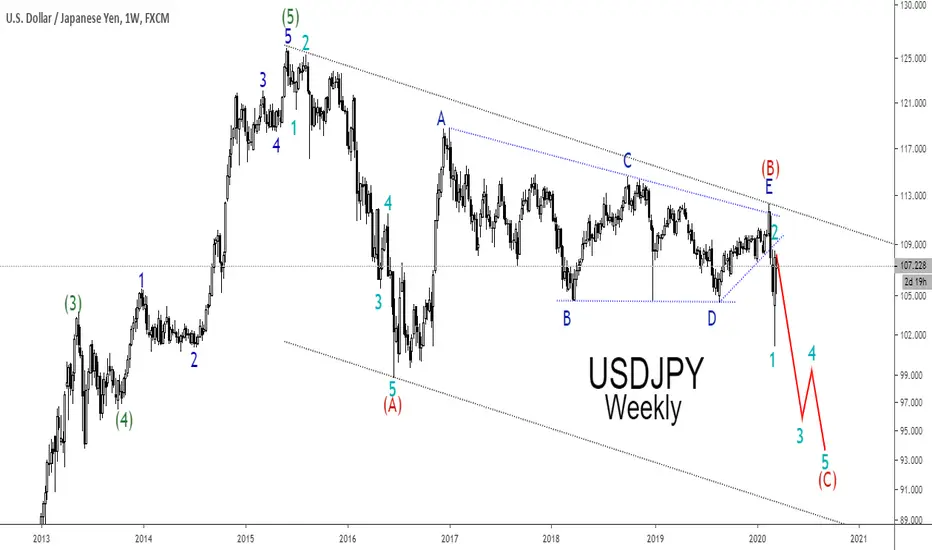
The weekly chart above shows USDJPY's entire decline from June 2015 high. The sell-off from June 2015 high to 2016 low can be seen as a five-wave Elliot wave impulse pattern in wave (A). The sharp decline suggests that a massive zigzag is in the making and it's not completed yet.
According to the Elliot Wave principle, a three-wave retracement pattern follows every impulse structure. In USDJPY's case, the sideways and contracting price action pattern started from June 2016 low to Feb 2020 can be seen as an Elliot Wave Triangle corrective pattern.
The triangle correction is completed when the price breached the triangle support impulsively. Below is the H4 structure.

Once a corrective pattern is completed, the price resumes in the direction of the dominant impulse, which is bearish in the USDJPY case.
If this count is correct, USDJPY has the potential to move lower to 2016 low "wave (A)," and even further lower in wave (C) to complete the massive (A)-(B)-(C) zigzag pattern.
Do you think UJ can trade to 2016 low?
According to the Elliot Wave principle, a three-wave retracement pattern follows every impulse structure. In USDJPY's case, the sideways and contracting price action pattern started from June 2016 low to Feb 2020 can be seen as an Elliot Wave Triangle corrective pattern.
The triangle correction is completed when the price breached the triangle support impulsively. Below is the H4 structure.
Once a corrective pattern is completed, the price resumes in the direction of the dominant impulse, which is bearish in the USDJPY case.
If this count is correct, USDJPY has the potential to move lower to 2016 low "wave (A)," and even further lower in wave (C) to complete the massive (A)-(B)-(C) zigzag pattern.
Do you think UJ can trade to 2016 low?
Haftungsausschluss
Die Informationen und Veröffentlichungen sind nicht als Finanz-, Anlage-, Handels- oder andere Arten von Ratschlägen oder Empfehlungen gedacht, die von TradingView bereitgestellt oder gebilligt werden, und stellen diese nicht dar. Lesen Sie mehr in den Nutzungsbedingungen.
Haftungsausschluss
Die Informationen und Veröffentlichungen sind nicht als Finanz-, Anlage-, Handels- oder andere Arten von Ratschlägen oder Empfehlungen gedacht, die von TradingView bereitgestellt oder gebilligt werden, und stellen diese nicht dar. Lesen Sie mehr in den Nutzungsbedingungen.