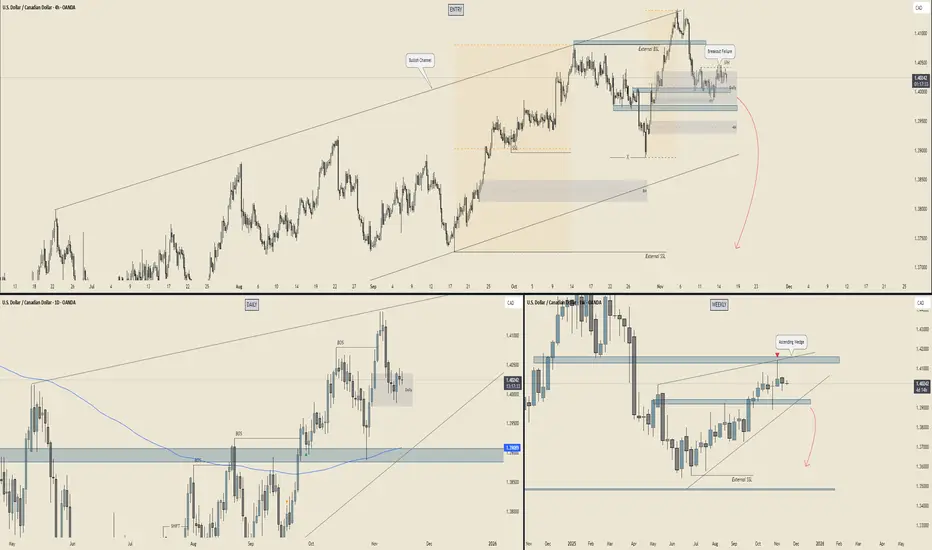
🧱 WEEKLY – The Big Dog View
Bias: 🐻 Bearish pressure building
Why:
Price is pushing into that massive weekly supply while sitting inside an ascending wedge — textbook distribution energy.
The wedge resistance + supply block is basically a double whammy ceiling.
Reaction wicks show buyers getting tired… sellers warming up.
Beneath current price? A HUGE vacuum of clean, unmitigated price action → easy liquidity to the downside.
🎯 Weekly Target Zones:
1.3900–1.3850 = first stop (mid-range demand)
1.3650–1.3550 = main deep target
External SSL much lower = long-term magnet
👉 Weekly says: “Yo… down only unless we get a breakout above supply.”
📆 DAILY – Internal Structure Rolling Over
Bias: 🐻 Turning bearish
Why: Daily BOS formed on the drop → clear bearish intent.
Price pulled back into a fresh daily supply, reacted cleanly, and is now stalling.
Daily is coiling under resistance = distribution micro-pattern.
As long as the daily mitigation block holds, rallies are just liquidity grabs.
🔥 Daily Key Levels:
Hold below 1.4070 = bearish continuation
Break below 1.3950 = flush into 1.3900
Lose 1.3900 = full send toward 1.38 → 1.37
👉 Daily is setting up the breakdown leg.
⏳ 4H – The Execution Chart (The Juice)
Bias: 🐻 Bearish retest + roll
Why: The 4H bullish channel got broken → structure shift.
We even have a breakout failure at the top = classic “trap the buyers then nuke it.”
4H supply stacking beautifully (Daily + 4H combo).
Price trapped sideways waiting for a trigger → likely a fake-out pop then drop, or a straight collapse.
📌 4H Key Areas:
4H supply: 1.4030–1.4060 = Sell zone
4H support: 1.3950 = Break this → waterfall
Next demand: 1.3880 then the huge imbalance to 1.3800
🎯 4H Targets:
Short-term: 1.3950
Medium: 1.3880
Main: 1.3800
🚀 SUMMARY – USD/CAD Forecast
🔥 Overall Bias: BEARISH (Weekly + Daily + 4H aligned)
🔽 Direction: Expect downside continuation
🎯 Main Target: 1.3800
🧯 Invalidation: Clean daily close above 1.4070 (rare unless oil nukes or USD goes parabolic)
✨ The Likely Path:
Small 4H pullback into supply
Break of 1.3950 internal floor
Fast slide into 1.3880
Larger drop toward 1.3800–1.3750
Haftungsausschluss
Die Informationen und Veröffentlichungen sind nicht als Finanz-, Anlage-, Handels- oder andere Arten von Ratschlägen oder Empfehlungen gedacht, die von TradingView bereitgestellt oder gebilligt werden, und stellen diese nicht dar. Lesen Sie mehr in den Nutzungsbedingungen.
Haftungsausschluss
Die Informationen und Veröffentlichungen sind nicht als Finanz-, Anlage-, Handels- oder andere Arten von Ratschlägen oder Empfehlungen gedacht, die von TradingView bereitgestellt oder gebilligt werden, und stellen diese nicht dar. Lesen Sie mehr in den Nutzungsbedingungen.