📊 Current Price Snapshot (Approx)
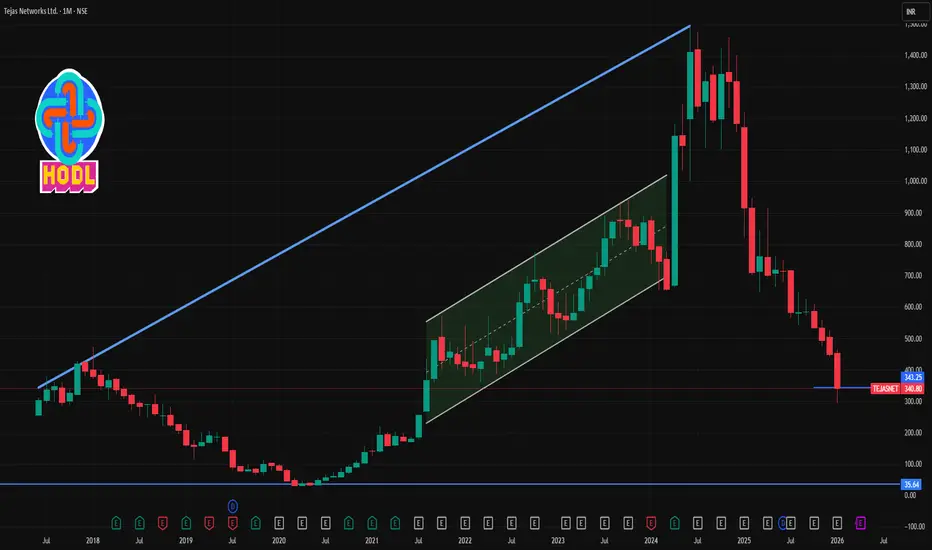
Last traded price ~ ₹330-₹345 on NSE/BSE during late Jan 2026, after recent volatility and sell-offs.
📉 1-Month Timeframe — Key Levels
🔻 Support Levels (Downside)
These are levels where the stock could find buyers or pause losses on a 1-month chart:
Support Zone Significance
₹320 – ₹325 Immediate support; recent intraday floor (current price region)
₹301 – ₹315 Secondary support zone from pivot breakdowns
₹285 – ₹300 Deeper support if broader bearish momentum continues
📈 Resistance Levels (Upside)
Resistance Zone Importance
₹355 – ₹360 1st resistance from short-term moving average relevance
₹370 – ₹375 Next resistance cluster near recent intraday reactions
₹390 – ₹395 Higher resistance if bounce gains strength
🧠 Technical Indicator Context (1-Month)
📉 Trend Bias: Bearish overall, price trading significantly below major moving averages (20-day, 50-day, etc.).
📊 RSI: Near oversold but not confirmed bottom — suggests bearish momentum but potential for short-term rebounds.
📉 MACD & STOCH: Bearish signals persist, indicating weak price action on the 1-month chart.
🗂 Summary — 1-Month View
⚠️ Bearish Bias: The stock is in a short-term downtrend, trading below key moving averages and suffering weak momentum.
🛑 Support in Focus: ₹320-₹315 first; further deeper zone near ₹285-₹300 if bears intensify.
📈 Resistance Roadblock: ₹355-₹360 key for initial bounce; stronger rally needs break above ₹370+.
📉 Bearish Technicals: RSI not strongly indicating reversal yet; MACD remains bearish.
Verbundene Veröffentlichungen
Haftungsausschluss
Die Informationen und Veröffentlichungen sind nicht als Finanz-, Anlage-, Handels- oder andere Arten von Ratschlägen oder Empfehlungen gedacht, die von TradingView bereitgestellt oder gebilligt werden, und stellen diese nicht dar. Lesen Sie mehr in den Nutzungsbedingungen.