📈 1-Week Performance
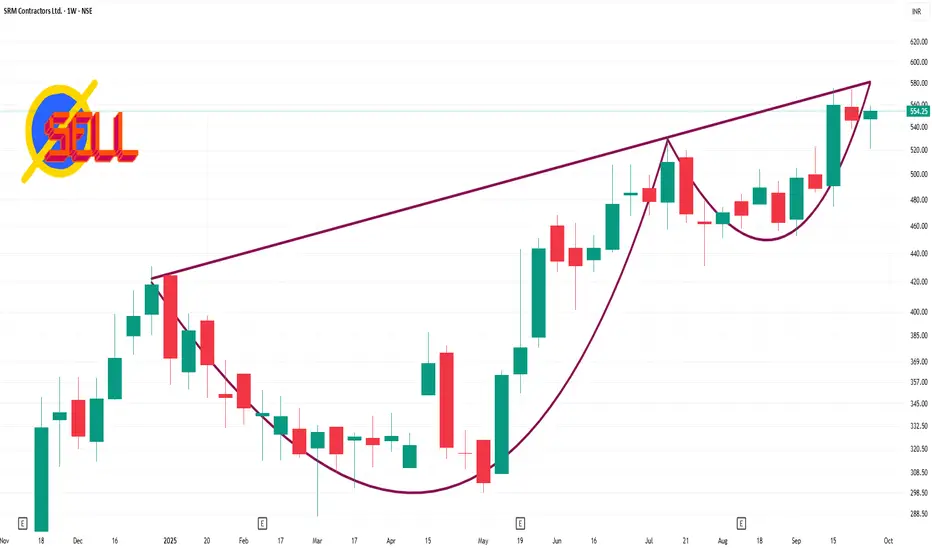
Over the past week, the stock has appreciated by 1.51%
📊 Key Metrics
52-Week High: ₹575.20
52-Week Low: ₹246.00
Market Cap: Approximately ₹1,272 crore
P/E Ratio: 19.63
P/B Ratio: 4.5
The stock is currently trading above its 50-day and 200-day Simple Moving Averages, indicating a bullish trend.
🔍 Technical Outlook
The stock's current price above both the 50-day and 200-day SMAs indicates a bullish trend. The RSI suggests that the stock is in a neutral zone, neither overbought nor oversold, which could imply room for further upside. However, investors should monitor for any signs of overbought conditions or significant resistance levels near the 52-week high of ₹575.20.
Verbundene Veröffentlichungen
Haftungsausschluss
Die Informationen und Veröffentlichungen sind nicht als Finanz-, Anlage-, Handels- oder andere Arten von Ratschlägen oder Empfehlungen gedacht, die von TradingView bereitgestellt oder gebilligt werden, und stellen diese nicht dar. Lesen Sie mehr in den Nutzungsbedingungen.