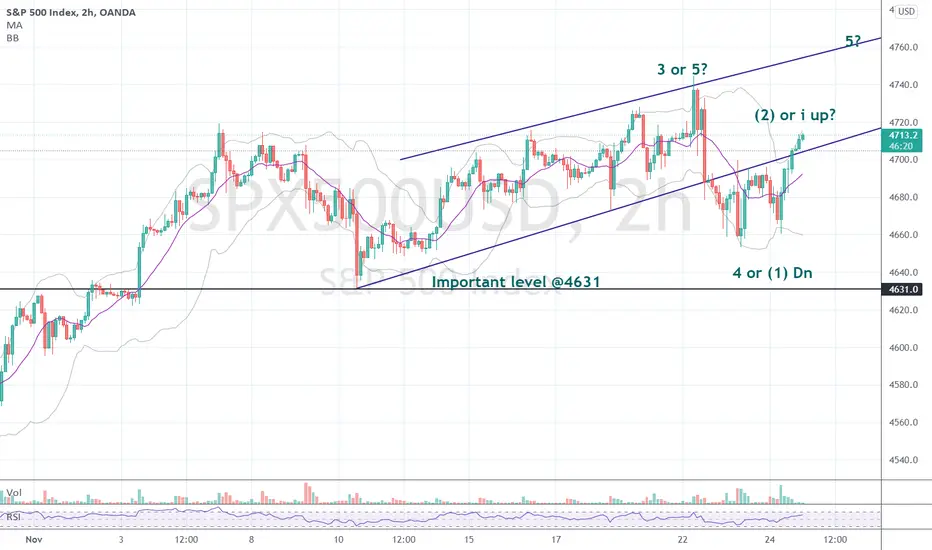
Long held trends tend to hold-up, well... long. I've labeled the chart with 2 of what I think are the most plausible EW count scenarios. It does allow to see where the risk and acceleration levels likely are. Only time will tell if the top is in, or if we are going still higher yet.
Trade ist aktiv
At time of writing the SPX500 has dropped substantially. So the bear market count comes into play. Have said that the current shape of the downturn could also be interpreted as an ABC and the correction could end soon. The next few trading days will clear up the picture.Haftungsausschluss
Die Informationen und Veröffentlichungen sind nicht als Finanz-, Anlage-, Handels- oder andere Arten von Ratschlägen oder Empfehlungen gedacht, die von TradingView bereitgestellt oder gebilligt werden, und stellen diese nicht dar. Lesen Sie mehr in den Nutzungsbedingungen.
Haftungsausschluss
Die Informationen und Veröffentlichungen sind nicht als Finanz-, Anlage-, Handels- oder andere Arten von Ratschlägen oder Empfehlungen gedacht, die von TradingView bereitgestellt oder gebilligt werden, und stellen diese nicht dar. Lesen Sie mehr in den Nutzungsbedingungen.