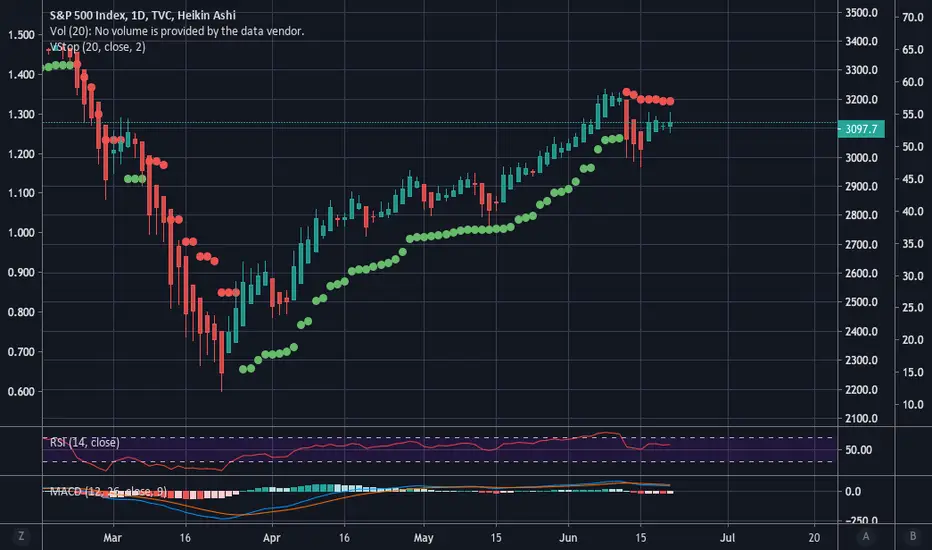
The daily chart using Heikin Ashi candles with volatility stops indicates that the trend changed to a downtrend last Thursday. A reasonable move back up would stop out these trending chart indicators, but they can be useful for longer-term trades. For instance, as you can see in the chart, had you traded off of these alone, you would have gone long on March 25th until last Thursday.
Haftungsausschluss
Die Informationen und Veröffentlichungen sind nicht als Finanz-, Anlage-, Handels- oder andere Arten von Ratschlägen oder Empfehlungen gedacht, die von TradingView bereitgestellt oder gebilligt werden, und stellen diese nicht dar. Lesen Sie mehr in den Nutzungsbedingungen.
Haftungsausschluss
Die Informationen und Veröffentlichungen sind nicht als Finanz-, Anlage-, Handels- oder andere Arten von Ratschlägen oder Empfehlungen gedacht, die von TradingView bereitgestellt oder gebilligt werden, und stellen diese nicht dar. Lesen Sie mehr in den Nutzungsbedingungen.