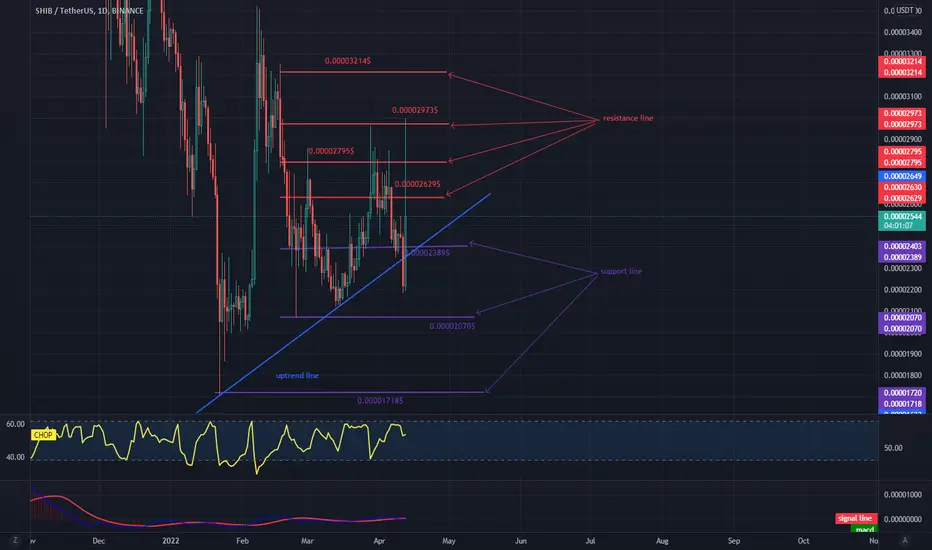
Hello everyone, let's take a look at the SHIB to USDT chart on the 1D Interval as we can see that the price has gone down and then quickly back above the local uptrend line.
Let's start with the designation of the support line and as you can see the first support in the near future is $ 0.00002389 on which the price is currently based if the support breaks, the next one is $ 0.00002070 and another $ 0.00001718.
Now let's move from the resistance line, as you can see, the first resistance is $ 0.00002629, if you can break it, the next resistance will be $ 0.00002795, the next resistance is $ 0.00002973 and the next one at $ 0.00003214.
Looking at the CHOP indicator, we can see that in the 1D interval we have a lot of energy for the next move.
Haftungsausschluss
Die Informationen und Veröffentlichungen sind nicht als Finanz-, Anlage-, Handels- oder andere Arten von Ratschlägen oder Empfehlungen gedacht, die von TradingView bereitgestellt oder gebilligt werden, und stellen diese nicht dar. Lesen Sie mehr in den Nutzungsbedingungen.
Haftungsausschluss
Die Informationen und Veröffentlichungen sind nicht als Finanz-, Anlage-, Handels- oder andere Arten von Ratschlägen oder Empfehlungen gedacht, die von TradingView bereitgestellt oder gebilligt werden, und stellen diese nicht dar. Lesen Sie mehr in den Nutzungsbedingungen.