📊 Weekly Technical Outlook
Overall Trend: The prevailing trend is bearish, with a "Strong Sell" signal on the weekly timeframe.
Moving Averages: All key moving averages—5-day, 10-day, 20-day, 50-day, 100-day, and 200-day—are indicating a "Sell" signal.
Relative Strength Index (RSI): The RSI is at 44.99, suggesting the stock is neither overbought nor oversold but leans towards a bearish stance.
MACD: The Moving Average Convergence Divergence (MACD) is positive at 1.73, indicating potential upward momentum.
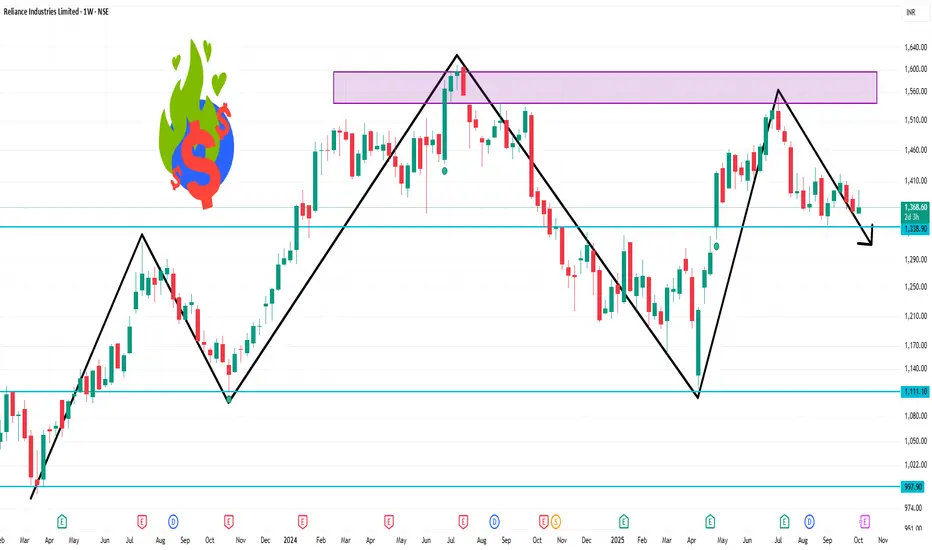
🔧 Key Support & Resistance Levels
Weekly Pivot Point: ₹1,369.77
Support Levels: ₹1,318.43, ₹1,337.67
Resistance Levels: ₹1,401.87, ₹1,414.73
🔍 Additional Indicators
Technical Summary: The stock is rated as a "Strong Sell" based on moving averages and technical indicators.
Pivot Analysis: Current price is trading below the weekly pivot point, indicating a bearish short-term outlook.
📈 Conclusion
Reliance Industries Ltd is currently in a bearish phase on the weekly chart, with all major moving averages signaling a "Sell." While the MACD suggests some potential for upward movement, the overall technical indicators and pivot analysis point towards caution. Traders should monitor the support levels closely; a break below ₹1,318.43 could lead to further downside.
Overall Trend: The prevailing trend is bearish, with a "Strong Sell" signal on the weekly timeframe.
Moving Averages: All key moving averages—5-day, 10-day, 20-day, 50-day, 100-day, and 200-day—are indicating a "Sell" signal.
Relative Strength Index (RSI): The RSI is at 44.99, suggesting the stock is neither overbought nor oversold but leans towards a bearish stance.
MACD: The Moving Average Convergence Divergence (MACD) is positive at 1.73, indicating potential upward momentum.
🔧 Key Support & Resistance Levels
Weekly Pivot Point: ₹1,369.77
Support Levels: ₹1,318.43, ₹1,337.67
Resistance Levels: ₹1,401.87, ₹1,414.73
🔍 Additional Indicators
Technical Summary: The stock is rated as a "Strong Sell" based on moving averages and technical indicators.
Pivot Analysis: Current price is trading below the weekly pivot point, indicating a bearish short-term outlook.
📈 Conclusion
Reliance Industries Ltd is currently in a bearish phase on the weekly chart, with all major moving averages signaling a "Sell." While the MACD suggests some potential for upward movement, the overall technical indicators and pivot analysis point towards caution. Traders should monitor the support levels closely; a break below ₹1,318.43 could lead to further downside.
Verbundene Veröffentlichungen
Haftungsausschluss
Die Informationen und Veröffentlichungen sind nicht als Finanz-, Anlage-, Handels- oder andere Arten von Ratschlägen oder Empfehlungen gedacht, die von TradingView bereitgestellt oder gebilligt werden, und stellen diese nicht dar. Lesen Sie mehr in den Nutzungsbedingungen.