✅ What we know
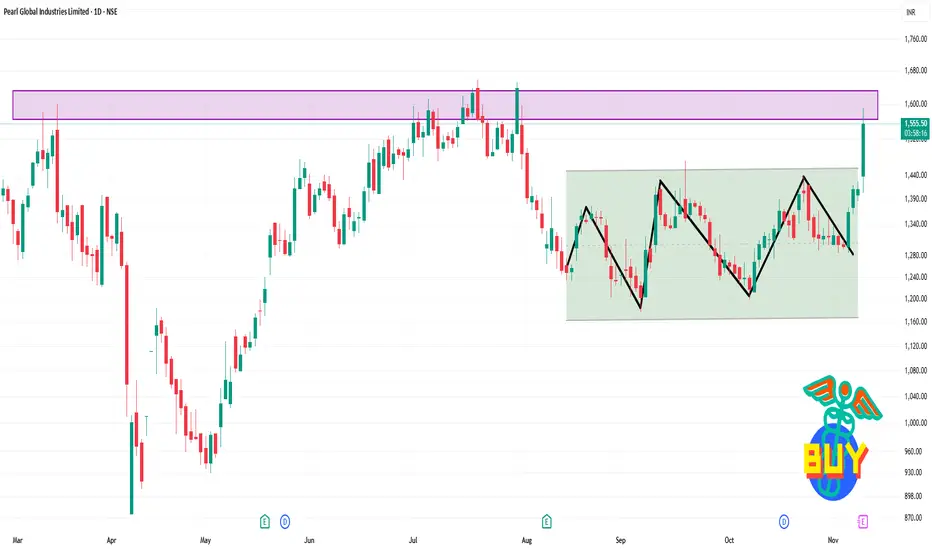
The stock is trading around ₹1,550 (approx) as of today, having opened near ~₹1,440 and with prior close around ~₹1,411
52-week high ~ ₹1,717, and 52-week low ~ ₹875.
Recent few days show an upward trend: ~₹1,297 → ~₹1,364 → ~₹1,410+.
🔍 Key levels for today
Support zone: Around ~ ₹1,350–₹1,380. Given recent lows around ~₹1,360-1,375 in last few sessions.
Resistance zone: Around ~ ₹1,600–₹1,620. Since the stock is now near ₹1,550, this is the near ceiling before reaching recent high territory.
If momentum holds, breakout above ~₹1,620 may open room towards ~₹1,700+.
On the flip side, a drop below ~₹1,350 would signal weakening in the short-term and could target lower support.
Verbundene Veröffentlichungen
Haftungsausschluss
Die Informationen und Veröffentlichungen sind nicht als Finanz-, Anlage-, Handels- oder andere Arten von Ratschlägen oder Empfehlungen gedacht, die von TradingView bereitgestellt oder gebilligt werden, und stellen diese nicht dar. Lesen Sie mehr in den Nutzungsbedingungen.