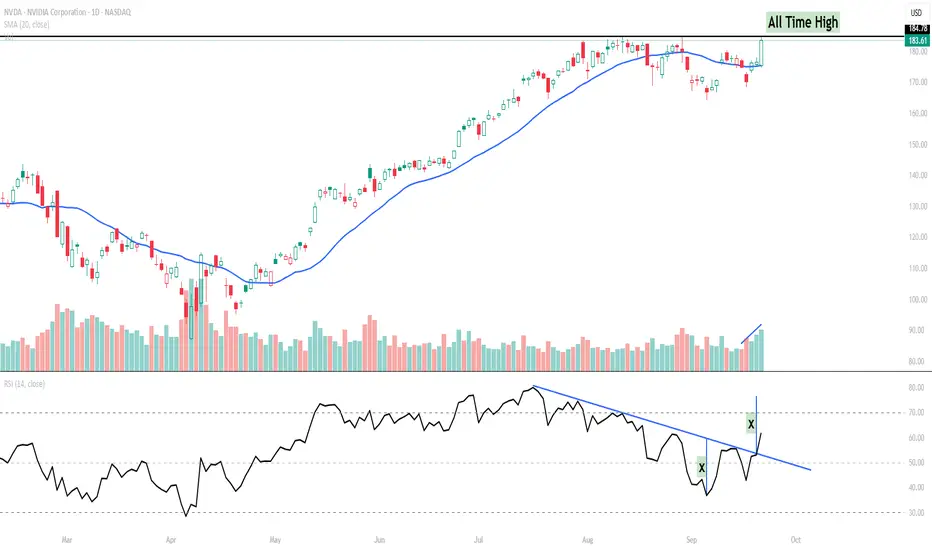
NVIDIA has staged a sharp move higher, reclaiming momentum after weeks of sideways-to-lower action. What makes this setup notable is not just the price, but the RSI trendline breakout.
Key Points:
RSI Trendline Breakout: The RSI broke above a descending trendline, suggesting momentum is shifting back in favour of buyers.
Volume Confirmation: The breakout coincided with a strong volume spike – often an early tell that institutions are stepping in.
Price Action: Price is now retesting the all-time high zone (~$184–185). A sustained close above this level could open the door for further upside.
Short-Term View: As long as NVDA holds above the $175–177 support zone, the bias remains bullish with potential for acceleration if RSI pushes toward the overbought zone.
Watchlist Levels:
Upside breakout trigger: $185+ (new all-time high)
Immediate support: $175
Momentum invalidation: Below $175
This is a classic case of how RSI trendline analysis can provide an early signal, often before price fully confirms the breakout.
Sharing indicator studies & global setups | twitter.com/gautam_icma
Haftungsausschluss
Die Informationen und Veröffentlichungen sind nicht als Finanz-, Anlage-, Handels- oder andere Arten von Ratschlägen oder Empfehlungen gedacht, die von TradingView bereitgestellt oder gebilligt werden, und stellen diese nicht dar. Lesen Sie mehr in den Nutzungsbedingungen.