Today NIFTY has crashed by 350+ points and reached 23165, a correction from 23800 levels .
Let me explain, This Nifty Daily chart is a classic example of how many fundamentals of Technical Analysis are satisfied.
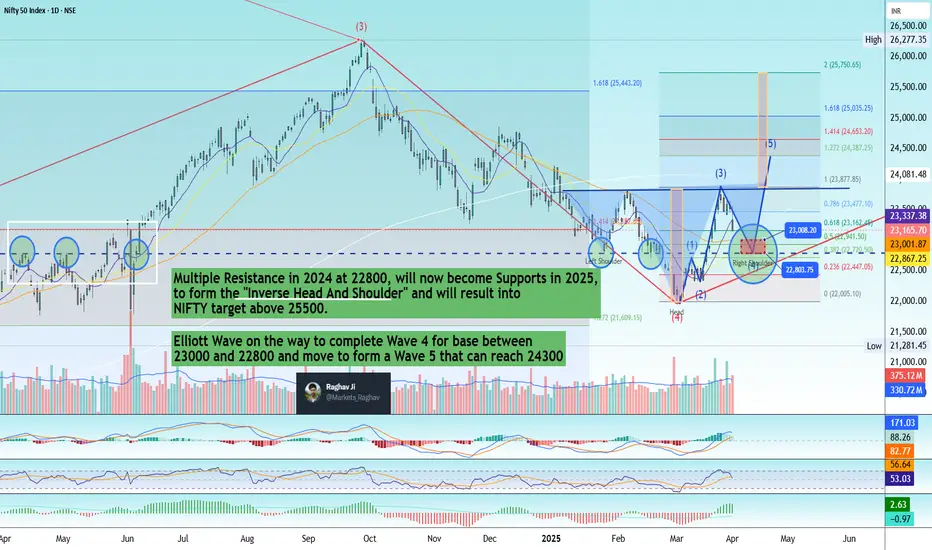
1) Old resistances in 2024 at 22800 will now become Support levels
2) If it goes to 23000 and stops at 22800 levels it also fulfils the Wave 4 criteria, which says that Wave 4 never gets in Wave 1 territory
3) If this happens, the chart also completes an Inverse Head and Shoulder's Right Shoulder bottom to make an up-move towards the Neck.
4) if it crosses the Neck, the targets of Nifty will be above 25500, which will be 2500+points.
Technicals are beautiful only when you practice them.
Let me explain, This Nifty Daily chart is a classic example of how many fundamentals of Technical Analysis are satisfied.
1) Old resistances in 2024 at 22800 will now become Support levels
2) If it goes to 23000 and stops at 22800 levels it also fulfils the Wave 4 criteria, which says that Wave 4 never gets in Wave 1 territory
3) If this happens, the chart also completes an Inverse Head and Shoulder's Right Shoulder bottom to make an up-move towards the Neck.
4) if it crosses the Neck, the targets of Nifty will be above 25500, which will be 2500+points.
Technicals are beautiful only when you practice them.
Haftungsausschluss
Die Informationen und Veröffentlichungen sind nicht als Finanz-, Anlage-, Handels- oder andere Arten von Ratschlägen oder Empfehlungen gedacht, die von TradingView bereitgestellt oder gebilligt werden, und stellen diese nicht dar. Lesen Sie mehr in den Nutzungsbedingungen.
Haftungsausschluss
Die Informationen und Veröffentlichungen sind nicht als Finanz-, Anlage-, Handels- oder andere Arten von Ratschlägen oder Empfehlungen gedacht, die von TradingView bereitgestellt oder gebilligt werden, und stellen diese nicht dar. Lesen Sie mehr in den Nutzungsbedingungen.