🧾 Chart Analysis Summary (Daily Timeframe)
Key Details Value
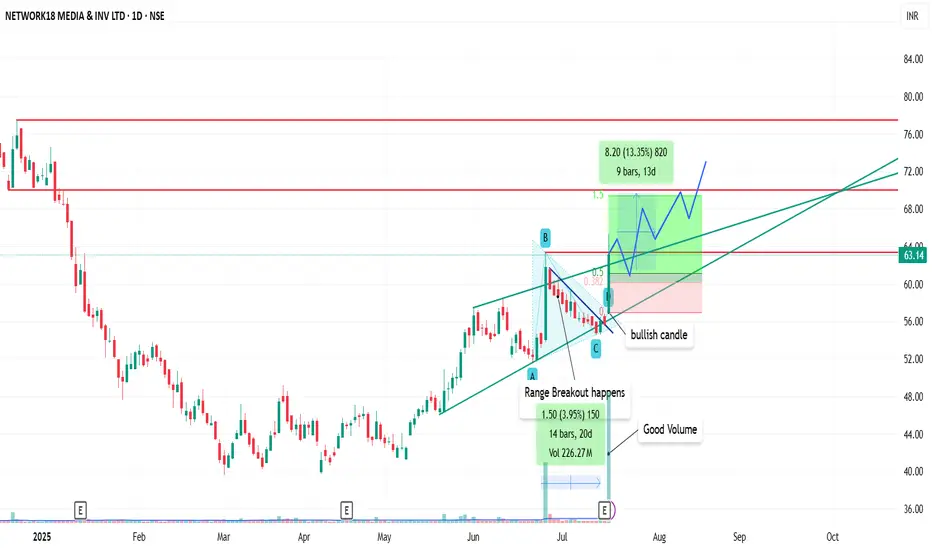
📈 CMP ₹63.14
🔺 Daily Gain +₹7.43 (+13.34%)
📊 Volume 318.44M (very strong volume)
🧱 Pattern ABC corrective structure + triangle breakout
📐 Setup Type Breakout + Pullback + Entry
🔍 Technical Analysis Insights
🟢 Bullish Structure
🔼 ABC Correction: Chart shows A-B-C correction forming a falling wedge/triangle.
✅ Breakout Confirmed: A strong bullish candle broke the range with high volume, confirming breakout.
🔄 Retest Entry Area: Entry zone is marked between ₹61–₹63 — current price is near the ideal buying zone.
🧱 Support Trendline: Strong diagonal support is visible; price is above it.
📦 Volume Spike
The huge green candle breakout has volume > 3x recent average, indicating strong buyer interest.
🎯 Trade Setup Parameters
Element Level / Note
🛒 Entry ₹61–₹63 (CMP is inside entry zone)
🛑 Stop Loss ₹58 (below breakout structure)
🎯 Target 1 (1.5x) ₹71–₹72 (around 13.35% up)
🧱 Target 2 ₹77–₹80 (next resistance zone)
⚖️ Risk:Reward 1:1.5+
💡 Observations
✅ Volume + Breakout + Retest = High Probability Trade.
⚠️ Monitor for consolidation between ₹64–₹67 before momentum resumes.
📌 Trail stop loss or partial booking advised near first target.
📝 Conclusion
This is a textbook breakout-retest-buy setup with:
Strong structure
Clear SL & target
Volume confirmation
Risk:Reward in favor
Key Details Value
📈 CMP ₹63.14
🔺 Daily Gain +₹7.43 (+13.34%)
📊 Volume 318.44M (very strong volume)
🧱 Pattern ABC corrective structure + triangle breakout
📐 Setup Type Breakout + Pullback + Entry
🔍 Technical Analysis Insights
🟢 Bullish Structure
🔼 ABC Correction: Chart shows A-B-C correction forming a falling wedge/triangle.
✅ Breakout Confirmed: A strong bullish candle broke the range with high volume, confirming breakout.
🔄 Retest Entry Area: Entry zone is marked between ₹61–₹63 — current price is near the ideal buying zone.
🧱 Support Trendline: Strong diagonal support is visible; price is above it.
📦 Volume Spike
The huge green candle breakout has volume > 3x recent average, indicating strong buyer interest.
🎯 Trade Setup Parameters
Element Level / Note
🛒 Entry ₹61–₹63 (CMP is inside entry zone)
🛑 Stop Loss ₹58 (below breakout structure)
🎯 Target 1 (1.5x) ₹71–₹72 (around 13.35% up)
🧱 Target 2 ₹77–₹80 (next resistance zone)
⚖️ Risk:Reward 1:1.5+
💡 Observations
✅ Volume + Breakout + Retest = High Probability Trade.
⚠️ Monitor for consolidation between ₹64–₹67 before momentum resumes.
📌 Trail stop loss or partial booking advised near first target.
📝 Conclusion
This is a textbook breakout-retest-buy setup with:
Strong structure
Clear SL & target
Volume confirmation
Risk:Reward in favor
Verbundene Veröffentlichungen
Haftungsausschluss
Die Informationen und Veröffentlichungen sind nicht als Finanz-, Anlage-, Handels- oder andere Arten von Ratschlägen oder Empfehlungen gedacht, die von TradingView bereitgestellt oder gebilligt werden, und stellen diese nicht dar. Lesen Sie mehr in den Nutzungsbedingungen.