📌 Current Price (Approx)
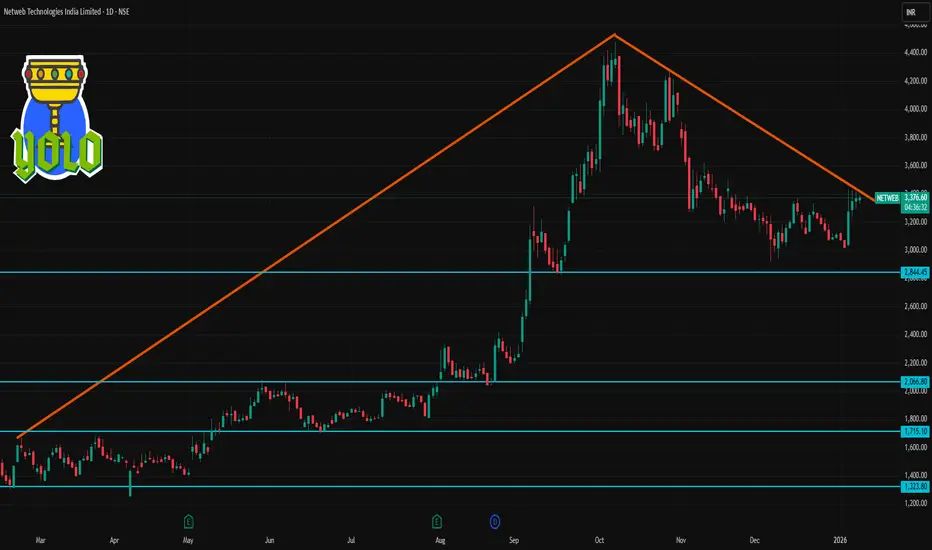
NETWEB ~ ₹3,347–₹3,368 on NSE (latest market price) — this is the recent traded range as markets open/continue today.
📊 Daily Technical Levels (1-Day Chart)
Pivot Point (Key Reference)
Pivot: ₹3,335–₹3,359 area — central decision zone for bulls vs bears.
🔥 Resistance Levels (Upside)
1. R1: ₹3,436–₹3,437 — first resistance zone.
2. R2: ₹3,525–₹3,526 — next upside hurdle.
3. R3: ₹3,626–₹3,627 — extended breakout target.
📉 Support Levels (Downside)
1. S1: ₹3,246–₹3,247 — immediate support.
2. S2: ₹3,145–₹3,145 — intermediate support line.
3. S3: ₹3,056–₹3,056 — deep support level.
📌 How to Use These Levels Today
Bullish bias: If price stays above pivot (~₹3,350) and breaks R1 ~₹3,436, next targets are R2 and R3.
Bearish bias: If price drops below S1 (~₹3,246), watch S2 and S3 for possible pullbacks/support zones.
📊 Short-Term Technical Mood
Pivot levels suggest an active trading range today — traders often use these references for intraday entry/exit.
RSI/MACD short-term signals are mixed to neutral, indicating a balanced fight between bulls and bears (not strongly overbought nor oversold on daily).
Verbundene Veröffentlichungen
Haftungsausschluss
Die Informationen und Veröffentlichungen sind nicht als Finanz-, Anlage-, Handels- oder andere Arten von Ratschlägen oder Empfehlungen gedacht, die von TradingView bereitgestellt oder gebilligt werden, und stellen diese nicht dar. Lesen Sie mehr in den Nutzungsbedingungen.