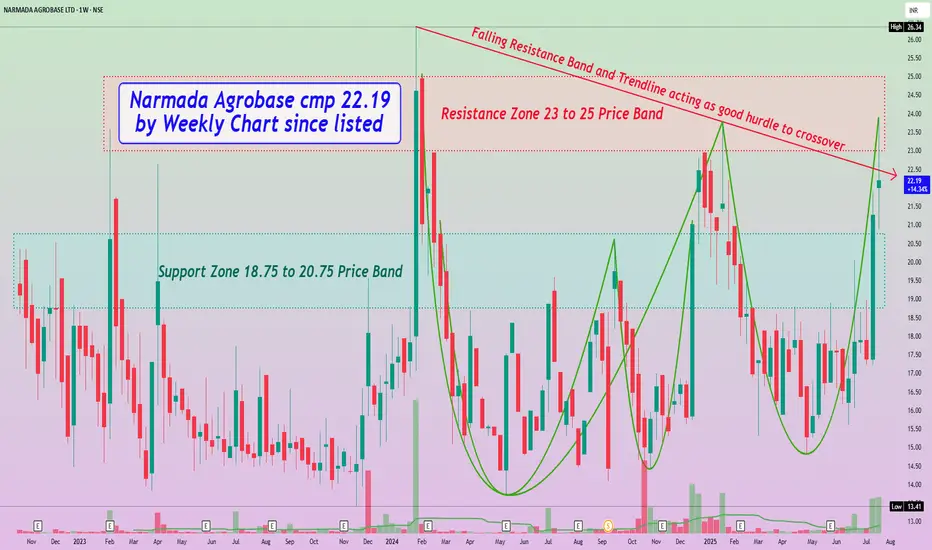
Narmada Agrobase cmp 22.19 by Weekly Chart since listed
- Support Zone 18.75 to 20.75 Price Band
- Resistance Zone seen at 23 to 25 Price Band
- Falling Resistance Band and Trendline acting as good hurdle to crossover
- Back to Back Bullish Rounding Bottoms formed at Resistance Zone neckline hurdle
- Volumes have spiked up heavily over past 2 weeks well above average traded quantity
- Most common Technical Indicators like BB, EMA, MACD, RSI, SAR are showing positive trend
Haftungsausschluss
Die Informationen und Veröffentlichungen sind nicht als Finanz-, Anlage-, Handels- oder andere Arten von Ratschlägen oder Empfehlungen gedacht, die von TradingView bereitgestellt oder gebilligt werden, und stellen diese nicht dar. Lesen Sie mehr in den Nutzungsbedingungen.
Haftungsausschluss
Die Informationen und Veröffentlichungen sind nicht als Finanz-, Anlage-, Handels- oder andere Arten von Ratschlägen oder Empfehlungen gedacht, die von TradingView bereitgestellt oder gebilligt werden, und stellen diese nicht dar. Lesen Sie mehr in den Nutzungsbedingungen.