📈 Technical Indicators (Daily Time Frame)
Overall Signal: Strong Buy
Moving Averages:
5-day: ₹1,113.28 (Sell)
50-day: ₹1,099.71 (Buy)
200-day: ₹1,087.01 (Buy)
Fibonacci Pivot Point: ₹1,114.13
Relative Strength Index (RSI): 52.5 — Neutral
MACD: +2.82 — Bullish
Technical Indicators: 3 Buy, 2 Sell
These indicators suggest a continuation of the current upward momentum, though the neutral RSI indicates caution against overbought conditions.
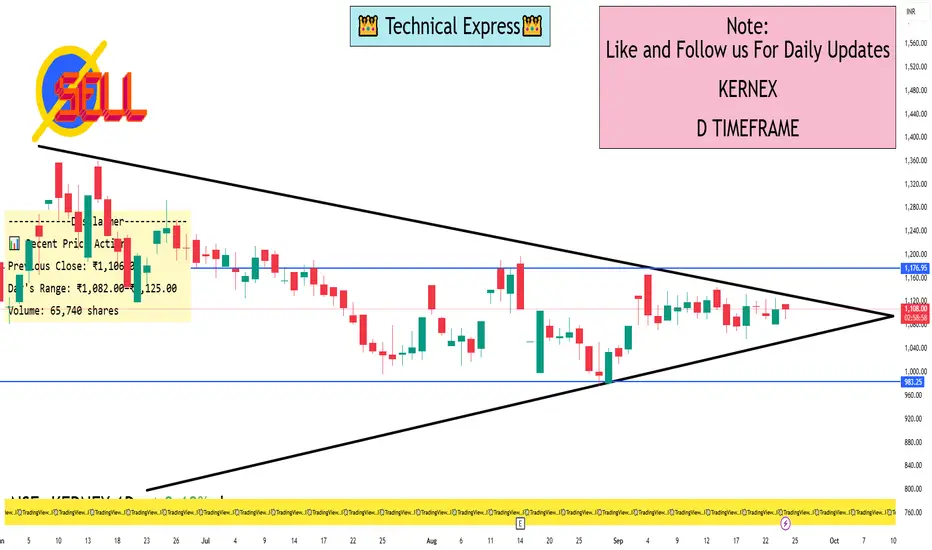
📊 Recent Price Action
The stock closed at ₹1,106.00 on September 23, 2025, marking a 0.89% increase from the previous day. The day's range was ₹1,082.00–₹1,125.00, with a volume of 65,740 shares.
🔮 Price Forecast
Short-term forecasts suggest a potential pullback to ₹1,075.70, possibly due to profit-taking or market consolidation.
📌 Conclusion
Kernex Microsystems India Ltd is currently in a strong bullish phase on the daily chart, supported by favorable moving averages and MACD. However, the neutral RSI and short-term price forecasts indicate a need for caution. Investors should monitor for any signs of reversal or consolidation before making further decisions.
Overall Signal: Strong Buy
Moving Averages:
5-day: ₹1,113.28 (Sell)
50-day: ₹1,099.71 (Buy)
200-day: ₹1,087.01 (Buy)
Fibonacci Pivot Point: ₹1,114.13
Relative Strength Index (RSI): 52.5 — Neutral
MACD: +2.82 — Bullish
Technical Indicators: 3 Buy, 2 Sell
These indicators suggest a continuation of the current upward momentum, though the neutral RSI indicates caution against overbought conditions.
📊 Recent Price Action
The stock closed at ₹1,106.00 on September 23, 2025, marking a 0.89% increase from the previous day. The day's range was ₹1,082.00–₹1,125.00, with a volume of 65,740 shares.
🔮 Price Forecast
Short-term forecasts suggest a potential pullback to ₹1,075.70, possibly due to profit-taking or market consolidation.
📌 Conclusion
Kernex Microsystems India Ltd is currently in a strong bullish phase on the daily chart, supported by favorable moving averages and MACD. However, the neutral RSI and short-term price forecasts indicate a need for caution. Investors should monitor for any signs of reversal or consolidation before making further decisions.
I built a Buy & Sell Signal Indicator with 85% accuracy.
📈 Get access via DM or
WhatsApp: wa.link/d997q0
Contact - +91 76782 40962
| Email: techncialexpress@gmail.com
| Script Coder | Trader | Investor | From India
📈 Get access via DM or
WhatsApp: wa.link/d997q0
Contact - +91 76782 40962
| Email: techncialexpress@gmail.com
| Script Coder | Trader | Investor | From India
Verbundene Veröffentlichungen
Haftungsausschluss
Die Informationen und Veröffentlichungen sind nicht als Finanz-, Anlage-, Handels- oder andere Arten von Ratschlägen oder Empfehlungen gedacht, die von TradingView bereitgestellt oder gebilligt werden, und stellen diese nicht dar. Lesen Sie mehr in den Nutzungsbedingungen.