📈 1-Week Performance Snapshot
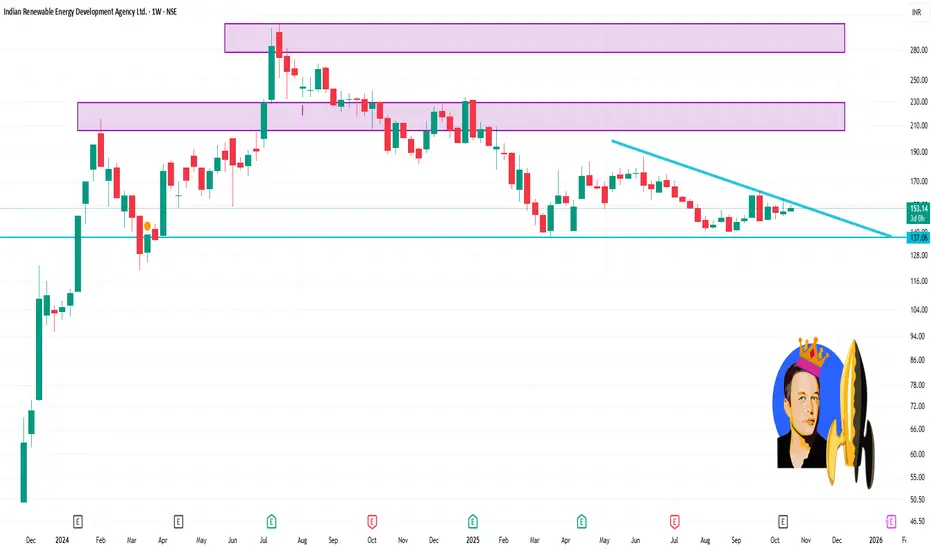
Current Price: ₹153.20
1-Week Change: Approximately +0.07%
1-Month Change: Approximately -1.92%
3-Month Change: Approximately -5.12%
1-Year Change: Approximately -30.65%
📊 Recent Trading Activity
October 20, 2025: Opened at ₹151.54, reached a high of ₹154.98, and closed at ₹153.42.
October 17, 2025: Opened at ₹153.00, reached a high of ₹153.38, and closed at ₹151.05.
October 15, 2025: Closed at ₹153.29 after reporting a net profit of ₹549.33 crore for Q2 FY26.
🔍 Technical Indicators
52-Week Range: ₹137.01 – ₹234.29
Market Capitalization: Approximately ₹43,079.56 crore
P/E Ratio: Approximately 23.49
Debt-to-Equity Ratio: Approximately 5.41
Dividend Yield: 0.00%
Verbundene Veröffentlichungen
Haftungsausschluss
Die Informationen und Veröffentlichungen sind nicht als Finanz-, Anlage-, Handels- oder andere Arten von Ratschlägen oder Empfehlungen gedacht, die von TradingView bereitgestellt oder gebilligt werden, und stellen diese nicht dar. Lesen Sie mehr in den Nutzungsbedingungen.