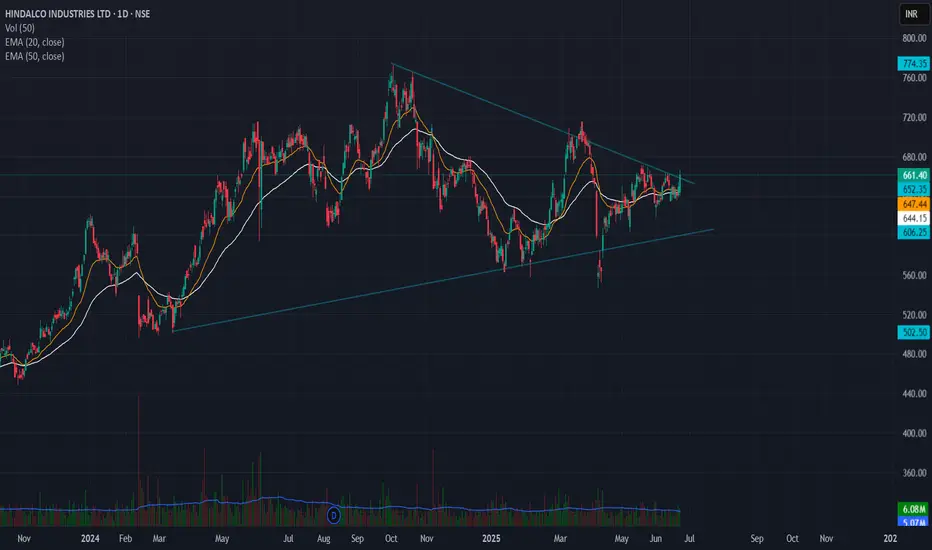
🔹 Pattern: Symmetrical Triangle
🔹 Breakout Level: ₹660
🔹 Stoploss: ₹635 (below swing low)
🔹 Target Zone: ₹850 – ₹900
🔹 Risk–Reward: 7.6 – 9.6
🔹 Timeframe: Positional (swing to medium term)
---
📊 Chart Analysis:
Hindalco has broken out of a well-defined symmetrical triangle on the daily chart, with strong price compression followed by bullish breakout confirmation.
The triangle height is ~₹200, projected from the breakout zone, giving a target range of ₹850–₹900.
🧠 Stoploss placed below the last swing low inside the triangle to avoid false breakdown traps.
Haftungsausschluss
Die Informationen und Veröffentlichungen sind nicht als Finanz-, Anlage-, Handels- oder andere Arten von Ratschlägen oder Empfehlungen gedacht, die von TradingView bereitgestellt oder gebilligt werden, und stellen diese nicht dar. Lesen Sie mehr in den Nutzungsbedingungen.
Haftungsausschluss
Die Informationen und Veröffentlichungen sind nicht als Finanz-, Anlage-, Handels- oder andere Arten von Ratschlägen oder Empfehlungen gedacht, die von TradingView bereitgestellt oder gebilligt werden, und stellen diese nicht dar. Lesen Sie mehr in den Nutzungsbedingungen.