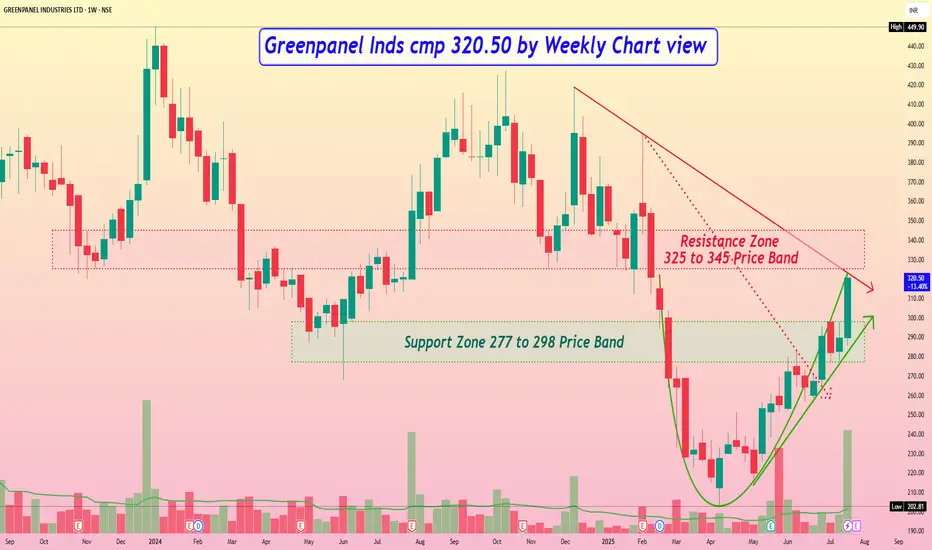
Greenpanel Inds cmp 320.50 by Weekly Chart view
- Support Zone 277 to 298 Price Band
- Resistance Zone 325 to 345 Price Band
- Bullish Rounding Bottom with Resistance Zone neckline
- Rising Support Trendline seems well respected by price momentum
- Volumes have surged very heavily over past week by demand based buying
- 1st Falling Resistance Trendline Brake out done and 2nd Trendline Breakout attempted
- Most common Technical Indicators like BB, EMA, MACD, RSI, SAR are showing positive trend
Haftungsausschluss
Die Informationen und Veröffentlichungen sind nicht als Finanz-, Anlage-, Handels- oder andere Arten von Ratschlägen oder Empfehlungen gedacht, die von TradingView bereitgestellt oder gebilligt werden, und stellen diese nicht dar. Lesen Sie mehr in den Nutzungsbedingungen.
Haftungsausschluss
Die Informationen und Veröffentlichungen sind nicht als Finanz-, Anlage-, Handels- oder andere Arten von Ratschlägen oder Empfehlungen gedacht, die von TradingView bereitgestellt oder gebilligt werden, und stellen diese nicht dar. Lesen Sie mehr in den Nutzungsbedingungen.