A Small-Cap Brewery Stock  GMBREW Broke Out With 10x Volume and Posted 61% Profit Growth in Q2 FY26. Let's Analyse in the "Chart of the Week"
As per the Latest SEBI Mandate, this isn't a Trading/Investment RECOMMENDATION nor for Educational Purposes; it is just for Informational purposes only. The chart data used is 3 Months old, as Showing Live Chart Data is not allowed according to the New SEBI Mandate.
Disclaimer: "I am not a SEBI REGISTERED RESEARCH ANALYST AND INVESTMENT ADVISER."
This analysis is intended solely for informational purposes and should not be interpreted as financial advice. It is advisable to consult a qualified financial advisor or conduct thorough research before making investment decisions.
Price Action Analysis:
Trend Structure:
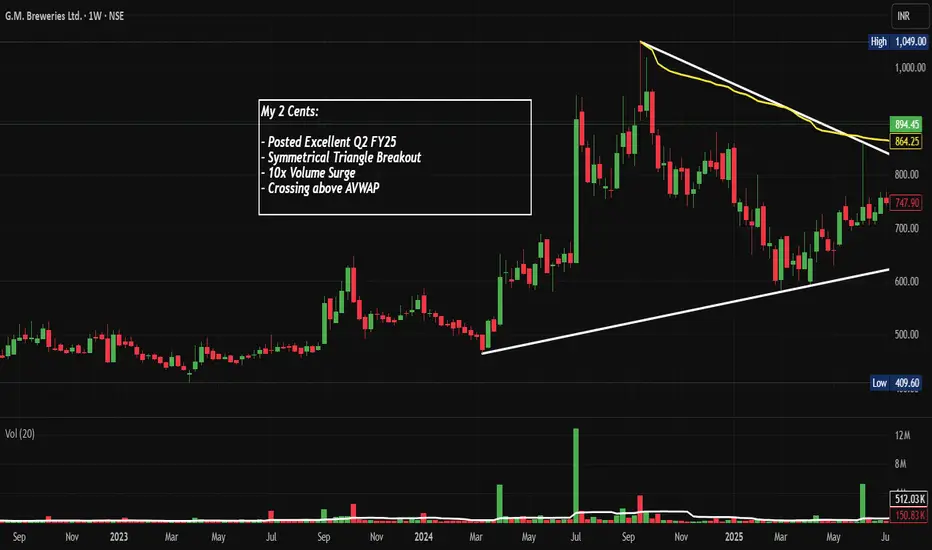
- The stock has been trading in a well-defined ascending triangle pattern from March 2023 to September 2025
- Lower trendline support starts around 500 levels and has been holding consistently
- Upper resistance formed a symmetrical descending trendline from the August 2024 peak near 1,049
- The consolidation phase between 650-750 lasted approximately 12-14 months, indicating strong accumulation
Recent Breakout Dynamics:
- On October 9, 2025, the stock witnessed a powerful breakout above the descending resistance trendline
- The breakout candle closed at 894.45, representing a gain of 22% in a Week
- Price crossed above the Volume Weighted Average Price (VWAP) with conviction
- The breakout occurred exactly at the apex of the symmetrical triangle, a textbook technical setup
Base Formation:
- A solid base was formed between 650-750 levels from June 2024 to September 2025
- This 15-month consolidation created a strong platform for the next leg up
- The base shows higher lows, indicating persistent buying interest
- Multiple tests of the 700 level without breaking down confirmed strong institutional support
Volume Spread Analysis:
Volume Surge Characteristics:
- The breakout day witnessed volume of 11.88 million shares, representing approximately 10x the average Weekly volume
- Prior peak volume was recorded in July 2024 at around 11 million shares during a similar rally
- The volume spike confirms genuine institutional participation rather than retail speculation
- Volume during the consolidation phase remained subdued, typical of healthy base-building
Volume-Price Correlation:
- The recent volume expansion coincided with the Q2 FY25 earnings announcement
- Volume preceded the price breakout, suggesting informed accumulation
- Absence of distribution volume during the decline from 1,049 to 650 indicates strong hands holding positions
Support and Resistance Levels:
Key Support Zones:
- Immediate support: 850-860 (breakout point and previous resistance turned support)
- Secondary support: 780-800 (VWAP zone)
- Major support: 700-720 (top of the consolidation base)
- Critical support: 650 (lower boundary of the triangle pattern)
Key Resistance Levels:
- Immediate resistance: 900-920 (psychological level and minor supply zone)
- Major resistance: 1,000-1,049 (previous 52-week high from August 2024)
- Extended resistance: 1,150-1,200 (measured move from triangle breakout)
- Long-term resistance: 1,300-1,350 (Fibonacci extension based on prior rally)
Technical Pattern Recognition:
Symmetrical Triangle Breakout:
- The pattern took 18 months to form, indicating a significant accumulation phase
- Pattern reliability is high, given the strong volume confirmation
- The apex breakout timing increases the probability of follow-through momentum
Volume Price Analysis (VPA):
- The breakout exhibits classic VPA characteristics: rising prices on expanding volume
- No signs of climactic selling during the base formation
- Professional money accumulation is evident from the volume footprint
- Current setup suggests continuation rather than exhaustion
Sectoral Backdrop and Industry Analysis:
Indian Alcohol Sector Overview:
- The Indian alcohol market is estimated at USD 60.11 billion in 2025 and expected to reach USD 101.10 billion by 2032, exhibiting a CAGR of 7.7%
- India's growing middle class is becoming more affluent, driving increased alcohol consumption as disposable incomes rise
- India's total alcoholic beverage sector is the world's third largest, with yearly sales of $44 billion
- In India, beverage alcohol volumes rose 4% in the first half of 2024, driven by strong demand for premium-plus spirits
Growth Drivers:
- Premiumization trend as consumers upgrade to higher-quality spirits and beer
- Expanding retail distribution channels, including modern trade and e-commerce
- Rising disposable incomes and urbanization are creating a larger addressable market
- Changing social attitudes toward moderate alcohol consumption, especially among younger demographics
- Tourism and hospitality sector recovery post-pandemic, boosting on-premise consumption
Sector Risks and Challenges:
- Heavy regulatory environment with varying state-level policies on alcohol sales
- High taxation is impacting margins and affordability
- Licensing complexities and distribution restrictions in certain states
- Raw material price volatility affecting input costs
- Social stigma and health concerns are potentially limiting market expansion
Fundamental Analysis:
Recent Financial Performance:
- In Q2 FY26, net profit rose 61% year-on-year, with revenue growing 20% to ₹718 crore, while EBITDA margin expanded to 6.25% from 4.62%
- For H1 FY26, total revenue reached ₹1,356 crore, marking 13% growth, with net profit rising 30% to ₹61 crore
- Margins saw healthy growth at 24.9% compared to 18.9% last year
- The strong Q2 results were the primary catalyst for the recent breakout
Company Fundamentals:
- Market capitalization stands at approximately 2,042 crore with annual revenue of 679 crore and profit of 143 crore
- Promoter holding is strong at 74.4%, indicating management confidence
- The company has delivered moderate sales growth of 6.32% over the past five years
- GM Breweries operates with no debt and demonstrates good profit growth
Valuation Metrics:
- As of October 9, 2025, GM Breweries is trading at a discount of 16% based on median intrinsic value estimates
- The stock trades in the small-cap segment with relatively lower liquidity compared to large-cap peers
- Recent earnings surprise has likely re-rated the stock, but valuation remains reasonable relative to growth
- P/E multiple expansion likely as margins improve and profitability accelerates
Competitive Positioning:
- Compared to industry leaders, GM Breweries lacks strong brand value and has limited market coverage
- The company operates primarily in select states, providing regional focus but limiting nationwide presence
- Opportunity exists to expand distribution footprint and invest in brand building
- Focus on operational efficiency and margin expansion differentiates from competitors
Bull Case Arguments:
- Strong earnings momentum with 61% profit growth, indicating operational leverage
- Technical breakout from 18-month base supported by exceptional volume confirms institutional interest
- Favourable industry tailwinds with 7.7% sector CAGR supporting long-term growth
- Debt-free balance sheet provides financial flexibility for expansion
- High promoter holding at 74.4% aligns management interests with shareholders
- Current valuation at 16% discount to intrinsic value offers a margin of safety
Bear Case Considerations:
- Limited brand recognition compared to established industry players
- Restricted geographic presence limits growth potential
- Heavy regulatory oversight and taxation pose ongoing challenges
- Small-cap liquidity concerns may lead to higher volatility
- Dependence on discretionary consumer spending makes business cyclical
- Historical revenue growth of 6.32% over five years is modest
Monitoring and Review Parameters:
Key Metrics to Track:
- Quarterly revenue and profit growth rates versus expectations
- Margin expansion, sustainability and operating leverage
- Volume growth in key markets and product categories
- Market share gains or losses relative to competitors
- Any changes in promoter holding or institutional ownership patterns
Technical Review Points:
- Weekly closing price relative to the breakout level of 850
- Volume sustainability above 3-4 million shares daily average
- Formation of higher highs and higher lows to confirm an uptrend
- Any breakdown below 780 would invalidate the bullish thesis
- RSI and momentum indicators for early signs of exhaustion
Risk Triggers:
- Fundamental: Any quarterly earnings miss or margin compression
- Technical: Weekly close below 780 or breach of major support zones
- Sectoral: Adverse regulatory changes or significant tax increases
- Market: Broader market correction below key support levels affecting risk appetite
- Time-based: If the stock underperforms the sector or broader market for two consecutive quarters
Full Coverage on my Newsletter this Week
Keep in the Watchlist and DOYR.
NO RECO. For Buy/Sell.
📌Thank you for exploring my idea! I hope you found it valuable.
🙏FOLLOW for more
👍BOOST if you found it useful.
✍️COMMENT below with your views.
Meanwhile, check out my other stock ideas on the right side until this trade is activated. I would love your feedback.
As per the Latest SEBI Mandate, this isn't a Trading/Investment RECOMMENDATION nor for Educational Purposes; it is just for Informational purposes only. The chart data used is 3 Months old, as Showing Live Chart Data is not allowed according to the New SEBI Mandate.
Disclaimer: "I am not a SEBI REGISTERED RESEARCH ANALYST AND INVESTMENT ADVISER."
This analysis is intended solely for informational purposes and should not be interpreted as financial advice. It is advisable to consult a qualified financial advisor or conduct thorough research before making investment decisions.
Price Action Analysis:
Trend Structure:
- The stock has been trading in a well-defined ascending triangle pattern from March 2023 to September 2025
- Lower trendline support starts around 500 levels and has been holding consistently
- Upper resistance formed a symmetrical descending trendline from the August 2024 peak near 1,049
- The consolidation phase between 650-750 lasted approximately 12-14 months, indicating strong accumulation
Recent Breakout Dynamics:
- On October 9, 2025, the stock witnessed a powerful breakout above the descending resistance trendline
- The breakout candle closed at 894.45, representing a gain of 22% in a Week
- Price crossed above the Volume Weighted Average Price (VWAP) with conviction
- The breakout occurred exactly at the apex of the symmetrical triangle, a textbook technical setup
Base Formation:
- A solid base was formed between 650-750 levels from June 2024 to September 2025
- This 15-month consolidation created a strong platform for the next leg up
- The base shows higher lows, indicating persistent buying interest
- Multiple tests of the 700 level without breaking down confirmed strong institutional support
Volume Spread Analysis:
Volume Surge Characteristics:
- The breakout day witnessed volume of 11.88 million shares, representing approximately 10x the average Weekly volume
- Prior peak volume was recorded in July 2024 at around 11 million shares during a similar rally
- The volume spike confirms genuine institutional participation rather than retail speculation
- Volume during the consolidation phase remained subdued, typical of healthy base-building
Volume-Price Correlation:
- The recent volume expansion coincided with the Q2 FY25 earnings announcement
- Volume preceded the price breakout, suggesting informed accumulation
- Absence of distribution volume during the decline from 1,049 to 650 indicates strong hands holding positions
Support and Resistance Levels:
Key Support Zones:
- Immediate support: 850-860 (breakout point and previous resistance turned support)
- Secondary support: 780-800 (VWAP zone)
- Major support: 700-720 (top of the consolidation base)
- Critical support: 650 (lower boundary of the triangle pattern)
Key Resistance Levels:
- Immediate resistance: 900-920 (psychological level and minor supply zone)
- Major resistance: 1,000-1,049 (previous 52-week high from August 2024)
- Extended resistance: 1,150-1,200 (measured move from triangle breakout)
- Long-term resistance: 1,300-1,350 (Fibonacci extension based on prior rally)
Technical Pattern Recognition:
Symmetrical Triangle Breakout:
- The pattern took 18 months to form, indicating a significant accumulation phase
- Pattern reliability is high, given the strong volume confirmation
- The apex breakout timing increases the probability of follow-through momentum
Volume Price Analysis (VPA):
- The breakout exhibits classic VPA characteristics: rising prices on expanding volume
- No signs of climactic selling during the base formation
- Professional money accumulation is evident from the volume footprint
- Current setup suggests continuation rather than exhaustion
Sectoral Backdrop and Industry Analysis:
Indian Alcohol Sector Overview:
- The Indian alcohol market is estimated at USD 60.11 billion in 2025 and expected to reach USD 101.10 billion by 2032, exhibiting a CAGR of 7.7%
- India's growing middle class is becoming more affluent, driving increased alcohol consumption as disposable incomes rise
- India's total alcoholic beverage sector is the world's third largest, with yearly sales of $44 billion
- In India, beverage alcohol volumes rose 4% in the first half of 2024, driven by strong demand for premium-plus spirits
Growth Drivers:
- Premiumization trend as consumers upgrade to higher-quality spirits and beer
- Expanding retail distribution channels, including modern trade and e-commerce
- Rising disposable incomes and urbanization are creating a larger addressable market
- Changing social attitudes toward moderate alcohol consumption, especially among younger demographics
- Tourism and hospitality sector recovery post-pandemic, boosting on-premise consumption
Sector Risks and Challenges:
- Heavy regulatory environment with varying state-level policies on alcohol sales
- High taxation is impacting margins and affordability
- Licensing complexities and distribution restrictions in certain states
- Raw material price volatility affecting input costs
- Social stigma and health concerns are potentially limiting market expansion
Fundamental Analysis:
Recent Financial Performance:
- In Q2 FY26, net profit rose 61% year-on-year, with revenue growing 20% to ₹718 crore, while EBITDA margin expanded to 6.25% from 4.62%
- For H1 FY26, total revenue reached ₹1,356 crore, marking 13% growth, with net profit rising 30% to ₹61 crore
- Margins saw healthy growth at 24.9% compared to 18.9% last year
- The strong Q2 results were the primary catalyst for the recent breakout
Company Fundamentals:
- Market capitalization stands at approximately 2,042 crore with annual revenue of 679 crore and profit of 143 crore
- Promoter holding is strong at 74.4%, indicating management confidence
- The company has delivered moderate sales growth of 6.32% over the past five years
- GM Breweries operates with no debt and demonstrates good profit growth
Valuation Metrics:
- As of October 9, 2025, GM Breweries is trading at a discount of 16% based on median intrinsic value estimates
- The stock trades in the small-cap segment with relatively lower liquidity compared to large-cap peers
- Recent earnings surprise has likely re-rated the stock, but valuation remains reasonable relative to growth
- P/E multiple expansion likely as margins improve and profitability accelerates
Competitive Positioning:
- Compared to industry leaders, GM Breweries lacks strong brand value and has limited market coverage
- The company operates primarily in select states, providing regional focus but limiting nationwide presence
- Opportunity exists to expand distribution footprint and invest in brand building
- Focus on operational efficiency and margin expansion differentiates from competitors
Bull Case Arguments:
- Strong earnings momentum with 61% profit growth, indicating operational leverage
- Technical breakout from 18-month base supported by exceptional volume confirms institutional interest
- Favourable industry tailwinds with 7.7% sector CAGR supporting long-term growth
- Debt-free balance sheet provides financial flexibility for expansion
- High promoter holding at 74.4% aligns management interests with shareholders
- Current valuation at 16% discount to intrinsic value offers a margin of safety
Bear Case Considerations:
- Limited brand recognition compared to established industry players
- Restricted geographic presence limits growth potential
- Heavy regulatory oversight and taxation pose ongoing challenges
- Small-cap liquidity concerns may lead to higher volatility
- Dependence on discretionary consumer spending makes business cyclical
- Historical revenue growth of 6.32% over five years is modest
Monitoring and Review Parameters:
Key Metrics to Track:
- Quarterly revenue and profit growth rates versus expectations
- Margin expansion, sustainability and operating leverage
- Volume growth in key markets and product categories
- Market share gains or losses relative to competitors
- Any changes in promoter holding or institutional ownership patterns
Technical Review Points:
- Weekly closing price relative to the breakout level of 850
- Volume sustainability above 3-4 million shares daily average
- Formation of higher highs and higher lows to confirm an uptrend
- Any breakdown below 780 would invalidate the bullish thesis
- RSI and momentum indicators for early signs of exhaustion
Risk Triggers:
- Fundamental: Any quarterly earnings miss or margin compression
- Technical: Weekly close below 780 or breach of major support zones
- Sectoral: Adverse regulatory changes or significant tax increases
- Market: Broader market correction below key support levels affecting risk appetite
- Time-based: If the stock underperforms the sector or broader market for two consecutive quarters
Full Coverage on my Newsletter this Week
Keep in the Watchlist and DOYR.
NO RECO. For Buy/Sell.
📌Thank you for exploring my idea! I hope you found it valuable.
🙏FOLLOW for more
👍BOOST if you found it useful.
✍️COMMENT below with your views.
Meanwhile, check out my other stock ideas on the right side until this trade is activated. I would love your feedback.
As per the Latest SEBI Mandate, this isn't a Trading/Investment RECOMMENDATION nor for Educational Purposes; it is just for Informational purposes only. The chart data used is 3 Months old, as Showing Live Chart Data is not allowed according to the New SEBI Mandate.
Disclaimer: "I am not a SEBI REGISTERED RESEARCH ANALYST AND INVESTMENT ADVISER."
This analysis is intended solely for informational purposes and should not be interpreted as financial advice. It is advisable to consult a qualified financial advisor or conduct thorough research before making investment decisions.
Trade ist aktiv
Made New All time High Verbundene Veröffentlichungen
Haftungsausschluss
Die Informationen und Veröffentlichungen sind nicht als Finanz-, Anlage-, Handels- oder andere Arten von Ratschlägen oder Empfehlungen gedacht, die von TradingView bereitgestellt oder gebilligt werden, und stellen diese nicht dar. Lesen Sie mehr in den Nutzungsbedingungen.
Verbundene Veröffentlichungen
Haftungsausschluss
Die Informationen und Veröffentlichungen sind nicht als Finanz-, Anlage-, Handels- oder andere Arten von Ratschlägen oder Empfehlungen gedacht, die von TradingView bereitgestellt oder gebilligt werden, und stellen diese nicht dar. Lesen Sie mehr in den Nutzungsbedingungen.