Aktualisiert
FSR breaks out of Descending Triangle LONG
$NYSE:FSR
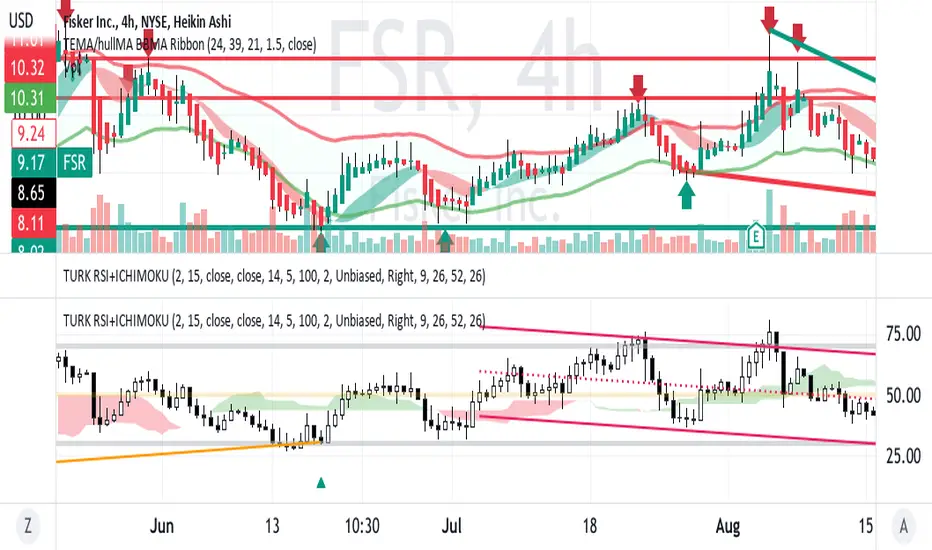
On the 4H chart with trendlines drawn FSR is trending up out of the triangle.
The RSI with Ichimoku indicator shows the confirmatory increasing relative strength
in a move from under to over the cloud.
All in all, this appears to be a swing long set up with a near upside of 20 %
or about $12 .
On the 4H chart with trendlines drawn FSR is trending up out of the triangle.
The RSI with Ichimoku indicator shows the confirmatory increasing relative strength
in a move from under to over the cloud.
All in all, this appears to be a swing long set up with a near upside of 20 %
or about $12 .
Trade ist aktiv
FSR had a nice 3% jump with a bullish candle after a doji showing buyers are taking trades.Haftungsausschluss
Die Informationen und Veröffentlichungen sind nicht als Finanz-, Anlage-, Handels- oder andere Arten von Ratschlägen oder Empfehlungen gedacht, die von TradingView bereitgestellt oder gebilligt werden, und stellen diese nicht dar. Lesen Sie mehr in den Nutzungsbedingungen.
Haftungsausschluss
Die Informationen und Veröffentlichungen sind nicht als Finanz-, Anlage-, Handels- oder andere Arten von Ratschlägen oder Empfehlungen gedacht, die von TradingView bereitgestellt oder gebilligt werden, und stellen diese nicht dar. Lesen Sie mehr in den Nutzungsbedingungen.