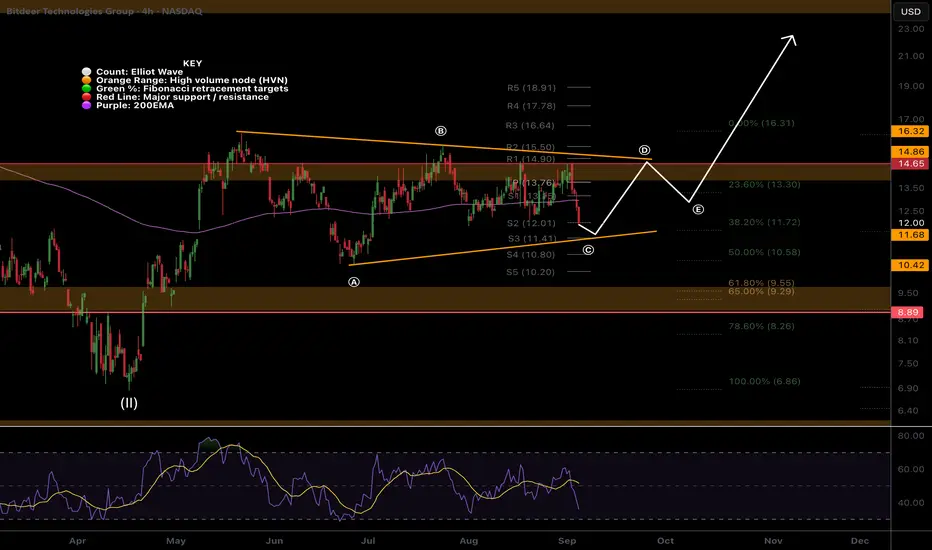
Wave c of an ABC within a triangle wave (C) appears to be underway with price closing below both the daily pivot and 200EMA. RSI has slight bullish divergence.
Until we get a break below wave (A) or a above wave (B) the analysis is good. Will readjust and update if anything changes. A breakdown below the triangle has a wave 2 target of the golden pocket Fibonacci retracement and HVN support at $9.63 and may offer a great buying opportunity.
Breakout target is the R5 daily pivot at $21.84
Safe trading
PhD Cand: Investing & Sentiment , MSc Financial Econ
Trader 8 years, Investor 15 years
The Sentiment Investor - Market Psychology: thesentimentinvestor.substack.com
Trade Planning, Strategies & Signals: Earn & Learn: tradesignals.substack.com
Trader 8 years, Investor 15 years
The Sentiment Investor - Market Psychology: thesentimentinvestor.substack.com
Trade Planning, Strategies & Signals: Earn & Learn: tradesignals.substack.com
Verbundene Veröffentlichungen
Haftungsausschluss
Die Informationen und Veröffentlichungen sind nicht als Finanz-, Anlage-, Handels- oder andere Arten von Ratschlägen oder Empfehlungen gedacht, die von TradingView bereitgestellt oder gebilligt werden, und stellen diese nicht dar. Lesen Sie mehr in den Nutzungsbedingungen.