#BTC (Update)
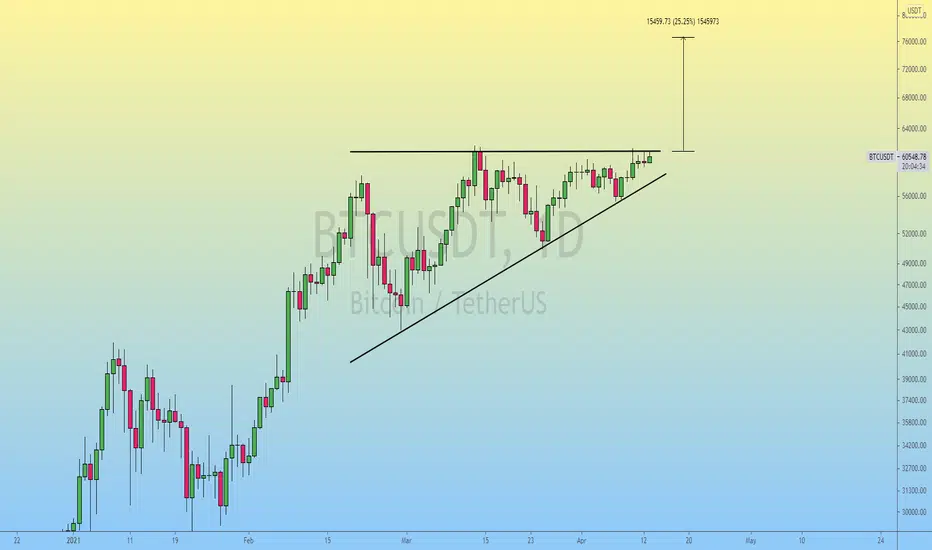
In Daily timeframe Chart, Bitcoin is Moving in Ascending Triangle Pattern..
At the Moment, Bulls Are Struggling to Clear the 61.2k Horizontal Resistance, Bulls Need More Volume for Upside Breakout.
If Daily candle Closed/Opened Above Horizontal Resistance (61.2k), Expecting +20-25% Bullish Wave.
In Worst Case, If Daily Candle Closed Below the 58k Trendline Support then Bitcoin might Retest the 44k Support Area.
Please like the idea for Support & Subscribe for More ideas like this and share your ideas and charts in Comments Section..!!
Thanks for Your Love & Support..!!
Follow me On Twitter & Telegram For More Regular Updates..!!
Public Telegram Channel:
t.me/CryptoCove
Forex Telegram Channel:
t.me/Captain_FX
Twitter:
twitter.com/CryptoFaibik
Instagram :
instagram.com/captain_faibik
Public Telegram Channel:
t.me/CryptoCove
Forex Telegram Channel:
t.me/Captain_FX
Twitter:
twitter.com/CryptoFaibik
Instagram :
instagram.com/captain_faibik
Haftungsausschluss
Die Informationen und Veröffentlichungen sind nicht als Finanz-, Anlage-, Handels- oder andere Arten von Ratschlägen oder Empfehlungen gedacht, die von TradingView bereitgestellt oder gebilligt werden, und stellen diese nicht dar. Lesen Sie mehr in den Nutzungsbedingungen.