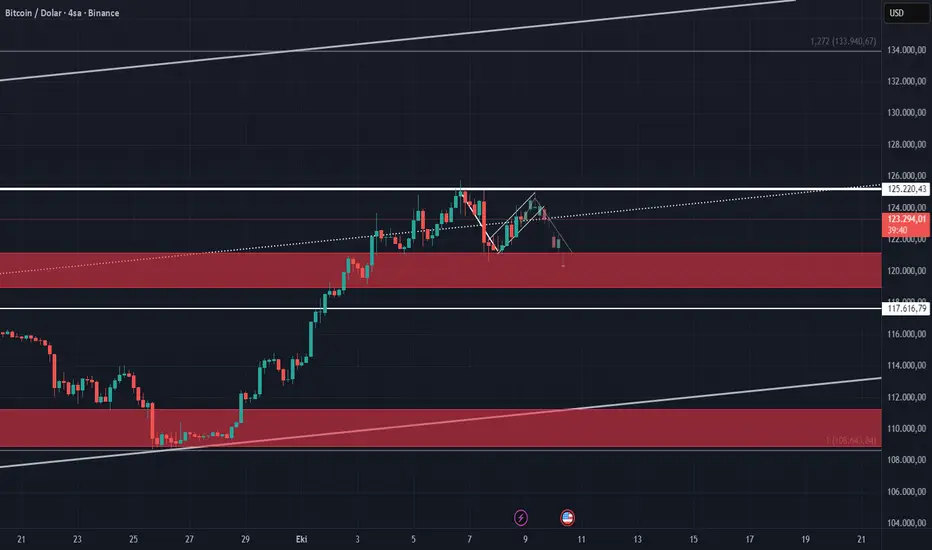
Bitcoin is currently forming a potential bear flag pattern, consolidating within the 121,200–119,000 zone — a key supply area that may define short-term direction.
A sustained break below 119,000 could trigger further downside pressure toward the 117,600 support.
Below that, the 111,000–108,600 range stands as a secondary demand block.
On the upside, 125,000 acts as a strong resistance level that needs to be reclaimed for any bullish momentum to develop.
The measured move from the bear flag projects a potential target around 121,000.
⚠️ This analysis is for educational purposes only and does not constitute financial advice.
#BTC #Bitcoin #CryptoAnalysis #BearFlag #TradingView #PriceAction
Trade geschlossen: Ziel wurde erreicht
Haftungsausschluss
Die Informationen und Veröffentlichungen sind nicht als Finanz-, Anlage-, Handels- oder andere Arten von Ratschlägen oder Empfehlungen gedacht, die von TradingView bereitgestellt oder gebilligt werden, und stellen diese nicht dar. Lesen Sie mehr in den Nutzungsbedingungen.
Haftungsausschluss
Die Informationen und Veröffentlichungen sind nicht als Finanz-, Anlage-, Handels- oder andere Arten von Ratschlägen oder Empfehlungen gedacht, die von TradingView bereitgestellt oder gebilligt werden, und stellen diese nicht dar. Lesen Sie mehr in den Nutzungsbedingungen.