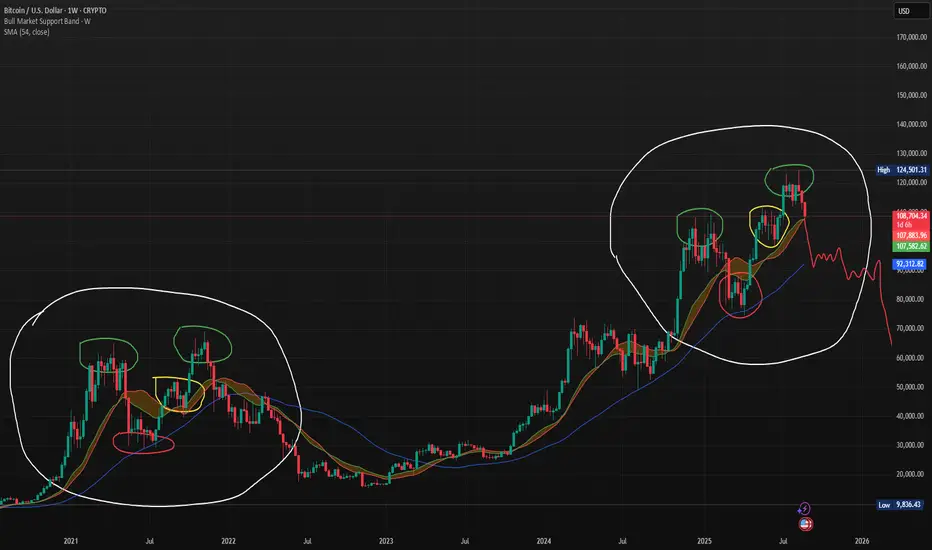
This chart compares Bitcoin’s current weekly price action to its 2021 market structure. Both periods show striking similarities: double-top patterns (green circles), mid-cycle consolidations (yellow highlights), and support retests (red circles) within the bull market support band. The projection in red outlines a potential bearish scenario, where BTC could follow a similar path to the last cycle—breaking below support and entering a prolonged corrective phase. Traders should watch the $92K SMA and bull market support band closely as critical levels for trend confirmation.
Haftungsausschluss
Die Informationen und Veröffentlichungen sind nicht als Finanz-, Anlage-, Handels- oder andere Arten von Ratschlägen oder Empfehlungen gedacht, die von TradingView bereitgestellt oder gebilligt werden, und stellen diese nicht dar. Lesen Sie mehr in den Nutzungsbedingungen.
Haftungsausschluss
Die Informationen und Veröffentlichungen sind nicht als Finanz-, Anlage-, Handels- oder andere Arten von Ratschlägen oder Empfehlungen gedacht, die von TradingView bereitgestellt oder gebilligt werden, und stellen diese nicht dar. Lesen Sie mehr in den Nutzungsbedingungen.