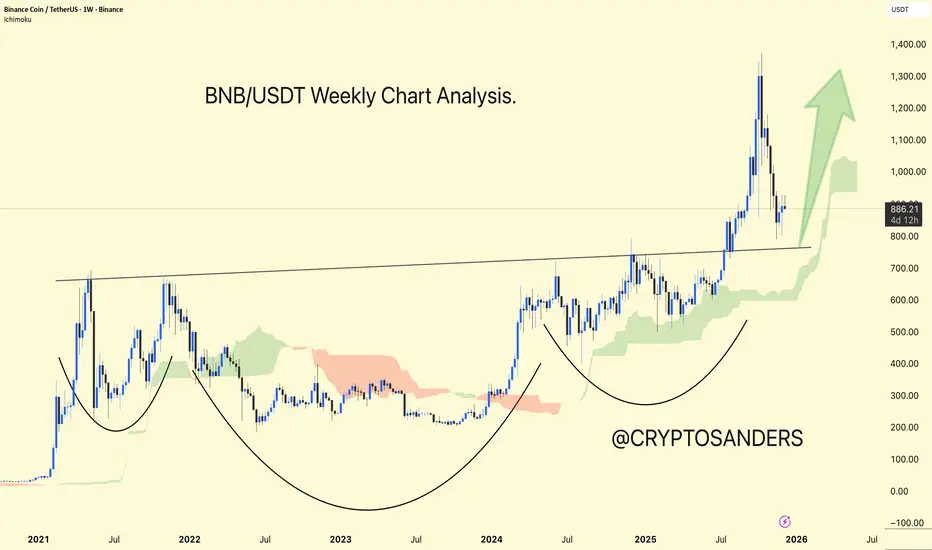
BNB/USDT is trading in the range of 800 to 900 and remains within a larger bullish structure, but on higher timeframes, the price is still below a significant resistance band in the 1,160–1,180 zone.
Recent technical analysis indicates that BNB is trading above its key moving averages, with most indicators in "buy" territory, confirming the ongoing uptrend. However, some readings are approaching overbought levels.
On the chart, significant resistance is shown near 1,160–1,180 (the upper wedge boundary), while support is initially found around 1,095–1,100 and then at 1,050–1,020 if the wedge base is broken.
DYOR | NFA,
Verbundene Veröffentlichungen
Haftungsausschluss
Die Informationen und Veröffentlichungen sind nicht als Finanz-, Anlage-, Handels- oder andere Arten von Ratschlägen oder Empfehlungen gedacht, die von TradingView bereitgestellt oder gebilligt werden, und stellen diese nicht dar. Lesen Sie mehr in den Nutzungsbedingungen.