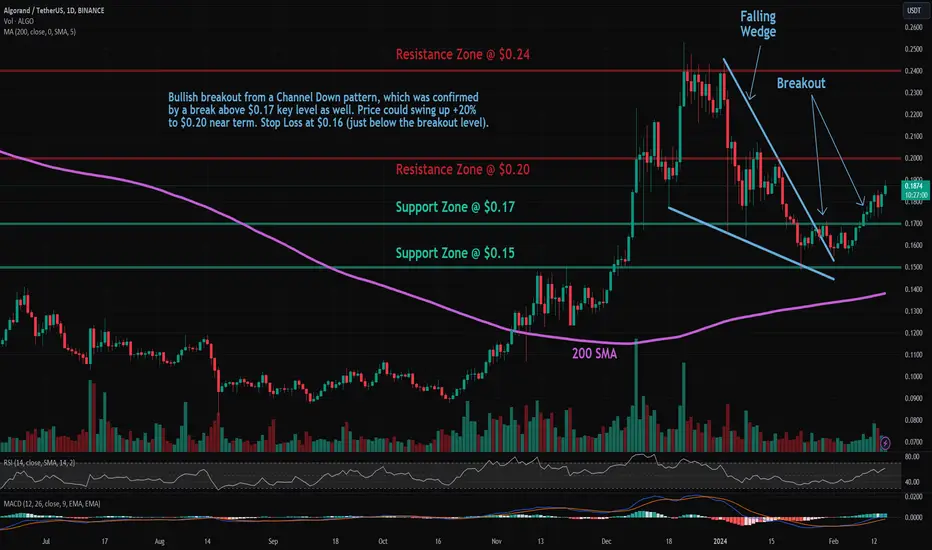
Trade setup: Bullish breakout from a Channel Down pattern was confirmed by a break above $0.17 key level. Price could swing up +20% to $0.20 near term. Stop Loss at $0.15 (just below the next support).
Patterns: Falling Wedge Usually results in a bullish breakout. When price breaks the upper trend line the price is expected to trend higher. Most traders should wait for a completed pattern with a breakout and then place a BUY order.
Trend: Neutral on Medium-Term basis and Uptrend on Short- and Long-Term basis.
Momentum is Bullish (MACD Line is above MACD Signal Line and RSI is above 55).
Support and Resistance: Nearest Support Zone is $0.17 (previous resistance), then $0.15. The nearest Resistance Zone is $0.20, then $0.24.
Haftungsausschluss
Die Informationen und Veröffentlichungen sind nicht als Finanz-, Anlage-, Handels- oder andere Arten von Ratschlägen oder Empfehlungen gedacht, die von TradingView bereitgestellt oder gebilligt werden, und stellen diese nicht dar. Lesen Sie mehr in den Nutzungsbedingungen.
Haftungsausschluss
Die Informationen und Veröffentlichungen sind nicht als Finanz-, Anlage-, Handels- oder andere Arten von Ratschlägen oder Empfehlungen gedacht, die von TradingView bereitgestellt oder gebilligt werden, und stellen diese nicht dar. Lesen Sie mehr in den Nutzungsbedingungen.