Technical Analysis
Recent technical analyses from web sources and X posts suggest a bullish outlook for ADA in the short to medium term, with specific price levels and patterns noted:Price Trends and Breakouts:As of July 24, 2025, ADA has broken out of a long-term downtrend and is retesting the breakout zone around $0.78. If this support holds, analysts predict a potential rally toward $1.20 or higher.
Earlier analyses (November 2024) indicated ADA was at a critical juncture, with a potential breakout to $1.25 if resistance was cleared, or consolidation into a triangle pattern if rejected.
A macro analysis from February 2025 highlights ADA maintaining a bullish structure above key invalidation levels, supported by its strong community and historical price action, suggesting a strong bullish continuation.
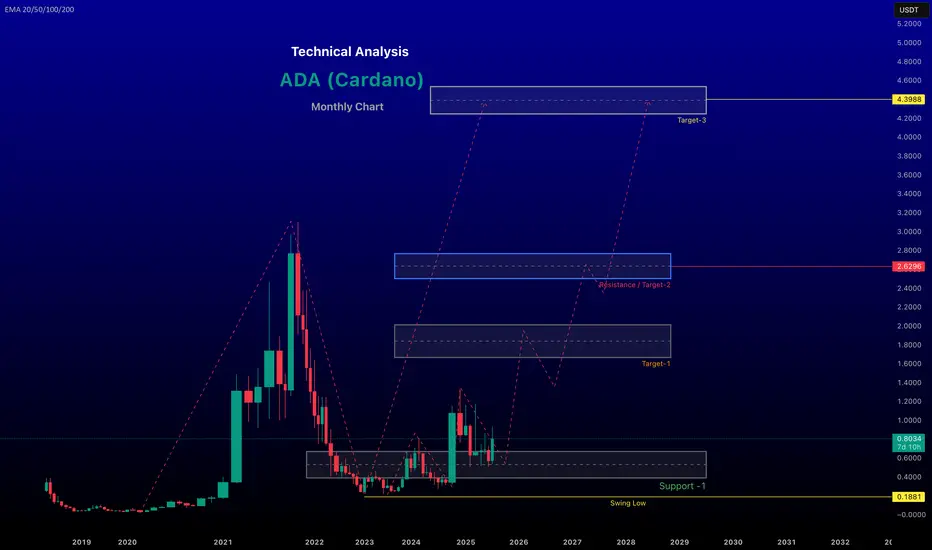
On a 4-hour timeframe, an ascending triangle breakout was observed around $0.777, with targets at $0.83 and $0.86, supported by higher lows and increased volume
for longer time frame target given in the chart
~~ Disclaimer ~~
This analysis is based on recent technical data and market sentiment from web sources. It is for informational \ educational purposes only and not financial advice. Trading involves high risks, and past performance does not guarantee future results. Always conduct your own research or consult a SEBI-registered advisor before trading.
# Boost and comment will be highly appreciated.
Recent technical analyses from web sources and X posts suggest a bullish outlook for ADA in the short to medium term, with specific price levels and patterns noted:Price Trends and Breakouts:As of July 24, 2025, ADA has broken out of a long-term downtrend and is retesting the breakout zone around $0.78. If this support holds, analysts predict a potential rally toward $1.20 or higher.
Earlier analyses (November 2024) indicated ADA was at a critical juncture, with a potential breakout to $1.25 if resistance was cleared, or consolidation into a triangle pattern if rejected.
A macro analysis from February 2025 highlights ADA maintaining a bullish structure above key invalidation levels, supported by its strong community and historical price action, suggesting a strong bullish continuation.
On a 4-hour timeframe, an ascending triangle breakout was observed around $0.777, with targets at $0.83 and $0.86, supported by higher lows and increased volume
for longer time frame target given in the chart
~~ Disclaimer ~~
This analysis is based on recent technical data and market sentiment from web sources. It is for informational \ educational purposes only and not financial advice. Trading involves high risks, and past performance does not guarantee future results. Always conduct your own research or consult a SEBI-registered advisor before trading.
# Boost and comment will be highly appreciated.
renderwithme
Haftungsausschluss
Die Informationen und Veröffentlichungen sind nicht als Finanz-, Anlage-, Handels- oder andere Arten von Ratschlägen oder Empfehlungen gedacht, die von TradingView bereitgestellt oder gebilligt werden, und stellen diese nicht dar. Lesen Sie mehr in den Nutzungsbedingungen.